August 18, 2020

Rugby Premiership Predictions for Round 15

Team Ratings for Round 15

The basic method is described on my Department home page.
Here are the team ratings prior to this week’s games, along with the ratings at the start of the season.

Current Rating Rating at Season Start Difference
Exeter Chiefs 10.01 7.99 2.00
Saracens 7.01 9.34 -2.30
Sale Sharks 5.77 0.17 5.60
Wasps 2.25 0.31 1.90
Gloucester 0.91 0.58 0.30
Bristol 0.01 -2.77 2.80
Bath -1.12 1.10 -2.20
Northampton Saints -1.44 0.25 -1.70
Harlequins -1.47 -0.81 -0.70
Leicester Tigers -3.08 -1.76 -1.30
London Irish -6.14 -5.51 -0.60
Worcester Warriors -6.50 -2.69 -3.80


Performance So Far

So far there have been 84 matches played, 55 of which were correctly predicted, a success rate of 65.5%.
Here are the predictions for last week’s games.

Game Date Score Prediction Correct
1 Harlequins vs. Sale Sharks Aug 15 16 – 10 -3.90 FALSE
2 Worcester Warriors vs. Gloucester Aug 15 15 – 44 -0.10 TRUE
3 Exeter Chiefs vs. Leicester Tigers Aug 15 26 – 13 18.20 TRUE
4 Bath vs. London Irish Aug 16 34 – 17 8.50 TRUE
5 Bristol vs. Saracens Aug 16 16 – 12 -3.40 FALSE
6 Northampton Saints vs. Wasps Aug 17 21 – 34 2.50 FALSE


Predictions for Round 15

Here are the predictions for Round 15. The prediction is my estimated expected points difference with a positive margin being a win to the home team, and a negative margin a win to the away team.

Game Date Winner Prediction
1 Sale Sharks vs. Exeter Chiefs Aug 22 Sale Sharks 0.30
2 Gloucester vs. Bristol Aug 22 Gloucester 5.40
3 Wasps vs. Worcester Warriors Aug 22 Wasps 13.20
4 Saracens vs. Harlequins Aug 22 Saracens 13.00
5 London Irish vs. Northampton Saints Aug 22 Northampton Saints -0.20
6 Leicester Tigers vs. Bath Aug 23 Leicester Tigers 2.50


NRL Predictions for Round 15

Team Ratings for Round 15

The basic method is described on my Department home page.
Here are the team ratings prior to this week’s games, along with the ratings at the start of the season.

Current Rating Rating at Season Start Difference
Storm 15.10 12.73 2.40
Roosters 10.18 12.25 -2.10
Raiders 5.83 7.06 -1.20
Panthers 5.07 -0.13 5.20
Eels 4.43 2.80 1.60
Rabbitohs 2.59 2.85 -0.30
Sharks 1.56 1.81 -0.20
Knights -0.38 -5.92 5.50
Sea Eagles -1.25 1.05 -2.30
Wests Tigers -1.90 -0.18 -1.70
Dragons -3.20 -6.14 2.90
Warriors -5.15 -5.17 0.00
Bulldogs -5.76 -2.52 -3.20
Cowboys -6.49 -3.95 -2.50
Broncos -11.22 -5.53 -5.70
Titans -11.40 -12.99 1.60


Performance So Far

So far there have been 112 matches played, 77 of which were correctly predicted, a success rate of 68.8%.
Here are the predictions for last week’s games.

Game Date Score Prediction Correct
1 Roosters vs. Storm Aug 13 6 – 24 -1.30 TRUE
2 Panthers vs. Warriors Aug 14 18 – 12 15.80 TRUE
3 Eels vs. Dragons Aug 14 12 – 14 11.00 FALSE
4 Sharks vs. Titans Aug 15 30 – 18 15.50 TRUE
5 Cowboys vs. Rabbitohs Aug 15 30 – 31 -7.90 TRUE
6 Raiders vs. Broncos Aug 15 36 – 8 17.90 TRUE
7 Wests Tigers vs. Bulldogs Aug 16 29 – 28 6.60 TRUE
8 Knights vs. Sea Eagles Aug 16 26 – 24 3.10 TRUE


Predictions for Round 15

Here are the predictions for Round 15. The prediction is my estimated expected points difference with a positive margin being a win to the home team, and a negative margin a win to the away team.

Game Date Winner Prediction
1 Eels vs. Storm Aug 20 Storm -8.70
2 Panthers vs. Sharks Aug 21 Panthers 5.50
3 Broncos vs. Dragons Aug 21 Dragons -6.00
4 Titans vs. Raiders Aug 22 Raiders -15.20
5 Wests Tigers vs. Roosters Aug 22 Roosters -10.10
6 Rabbitohs vs. Sea Eagles Aug 22 Rabbitohs 5.80
7 Bulldogs vs. Warriors Aug 23 Bulldogs 3.90
8 Knights vs. Cowboys Aug 23 Knights 8.10


August 15, 2020

Lotto, luck, and risk perception

There’s a big Lotto jackpot today, so it is my duty as a statistician to  write something about how people misunderstand probability. I don’t make the rules.

So, last week, I did a bogus poll on Twitter

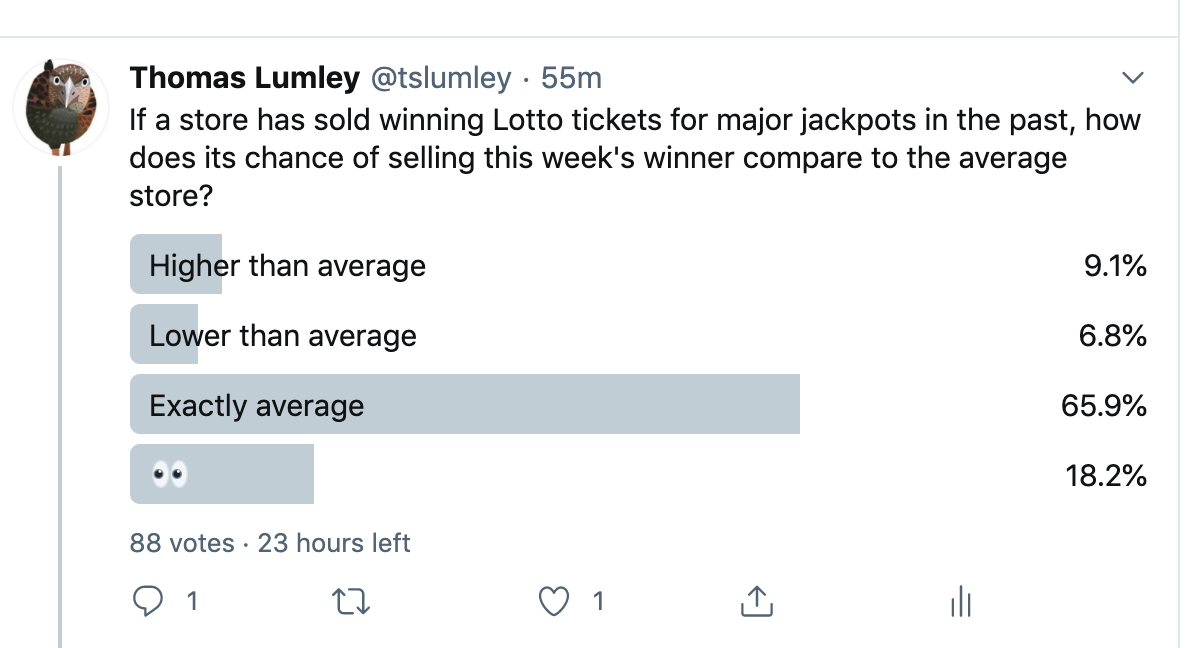
The results don’t tell you anything about any useful population,  because it was a bogus poll on Twitter, but it’s still interesting how many responses fell into the  trap.

Last week, we had headlines about ‘lucky’ stores to buy Lotto tickets.  Now, as you know, the probability that one of your chosen combinations wins does not depend at all on where you  bought the ticket, or how you chose the numbers. However, it is true that a shop which has sold winning tickets in the past is more likely to sell winning tickets in the future. Selling a winning ticket in the past is more likely for an outlet that sells lots of tickets, and an  outlet that sells lots of tickets is more  likely to sell  winning tickets in the future.  On top of that, it appears that people like to buy their tickets from outlets that have sold winning tickets in the past, which will increase the sales and therefore increase the number of future winners.  It doesn’t help the gamblers, but it does help the outlet.

In fact, saying it doesn’t help the  gamblers isn’t quite correct.   You’d hope, given the odds, that many people buying Lotto tickets were doing it primarily for entertainment (the cash return on tickets is negative, but that’s also true of beer and movies and rugby games and restaurant dinners).  Given that, anything that increases the entertainment value helps the gamblers,  and buying  from a ‘lucky’ store could count as a plus.

I also want to talk about a story in the Herald. It’s good on the  odds of winning and the impact of a ‘must win’ draw  — and quotes Dr Matt Parry, from Otago, which is generally a good indicator.  However, a separate part of the story says

Your chances of winning Powerball – one in 38 million – are less likely than you being struck by lightning – one in 280,000 – on your way to buy the ticket.

That seems not just wrong but incredibly wrong.   The story says “[m]ore than 1.9 million tickets were sold for the previous $50m must-be-won Powerball jackpot” (and that’s tickets, not lines), so at one in 280,000 we’d expect six or seven people to have been struck by lightning on their way to buy tickets.  According to this Radio NZ story, there were 13 ACC claims for lightning injury  in 3 years, and while that would leave out fatal injuries, the story also says a minority are fatal.  There’s no way you have a 1 in  280,000  chance of being struck by lightning on a routine shopping trip.

So where does this number come from? Well, the US also has a Powerball lottery, which has even lower odds of winning: one in  292 million. And there are news stories there with vaguely similar numbers.

The odds of grabbing the grand prize are 1 in 292.2 million, according to the game’s own assessment. To put this in context, your chances of being killed by a lightning strike are approximately 1 in 161,000. The odds of being killed in a shark attack are 1 in 3.7 million.

Even getting hit by a meteorite is more likely than winning the Powerball — 1 in 1.9 million.

The lightning-strike number looks to be a lifetime risk in the US, where lightning is more common than New Zealand, not the risk per shopping trip.

There are other problems with the numbers.  The 1 in 1.9 million for getting hit by a meteorite  is staggeringly wrong given that only one person in US history has been hit by a meteorite,  back in 1954.

How did the  1 in 1.9 million figure get past editing? Well, it probably wasn’t checked, but  there is a related number that’s arguably correct.  If you calculate the probability of dying due to a meteorite impact,  you have to consider the entire range of impacts from something the size of a golf  ball up to a significant asteroid.  The dinosaurs were wiped out (in part, probably) by an asteroid impact, 66 million years ago, so it would be reasonable to assume a risk in the ballpark of 1 in 100 million per year, giving a lifetime risk of experiencing the impact for an individual of one in a million or so.   Putting that together with expected  deaths from a major impact, it’s not unreasonable to get a 1 in two million risk for an individual  of dying because of an asteroid impact. On  the other hand, that’s not getting hit by a meteorite, and they shouldn’t be giving the number to two digits accuracy when even the order of magnitude must be uncertain.

So, if you’re in New Zealand and doing a careful risk assessment before buying a lottery ticket today, you probably don’t need to worry about lightning or low-flying rocks, but you should wear a mask. And if you’re in Auckland, maybe go to a local store or buy online.

Briefly

COViD edition:

  • T-cells. Recent research has found some people already have a T-cell immune response to the COViD virus — in some cases due to getting SARS Classic,  nearly two decade ago, and in some cases probably from animal coronaviruses. That’s encouraging for the prospects  of a vaccine.  But in the  US there are people saying this means those people are immune and we’re near the herd immunity threshold.  That’s completely untrue. The infectiousness of the virus was estimated from how fast it spreads in real populations — so if 50% of people are immune, that just means the virus is twice as infectious as we thought, and the herd immunity threshold is higher.
  • T-cells: Some people have T-cell responses already, but we don’t actually know those people are immune, or even less susceptible. As Ed Yong explains Immunology is where intuition goes to die
  • If you want to know about vaccine candidates for COVID: first, read the introduction by Siouxsie Wiles and Toby Morris, then look at the blogs of Hilda Bastian and Derek Lowe. Hilda is an expert on evidence in health and started out as a healthcare consumer advocate. Derek  is a pharmaceutical chemist.
  • What is genome sequencing for the virus and why? Basic introduction from Siouxsie and Toby at The Spinoff, more from David Welch’s op ed at Stuff
  • Why we need randomised trials: The Mayo Clinic, in the US, has given plasma from recovered COVID cases to more than 35,000 people and they still don’t really know if it works.
  • And now for something completely different: there’s an IMDB entry for the 1pm Covid Briefing, and reviews of season 2 are starting to stream in.
August 14, 2020

Rugby Premiership Predictions for Round 14

Team Ratings for Round 14

The basic method is described on my Department home page.
Here are the team ratings prior to this week’s games, along with the ratings at the start of the season.

Current Rating Rating at Season Start Difference
Exeter Chiefs 10.34 7.99 2.30
Saracens 7.45 9.34 -1.90
Sale Sharks 6.33 0.17 6.20
Wasps 1.43 0.31 1.10
Bristol -0.43 -2.77 2.30
Gloucester -0.49 0.58 -1.10
Northampton Saints -0.62 0.25 -0.90
Bath -1.61 1.10 -2.70
Harlequins -2.03 -0.81 -1.20
Leicester Tigers -3.41 -1.76 -1.70
Worcester Warriors -5.10 -2.69 -2.40
London Irish -5.65 -5.51 -0.10


Performance So Far

So far there have been 78 matches played, 52 of which were correctly predicted, a success rate of 66.7%.
Here are the predictions for last week’s games.

Game Date Score Prediction Correct
1 Bristol vs. Harlequins Mar 07 28 – 15 5.20 TRUE
2 Exeter Chiefs vs. Bath Mar 07 57 – 20 14.20 TRUE
3 Sale Sharks vs. London Irish Mar 07 39 – 0 14.00 TRUE
4 Saracens vs. Leicester Tigers Mar 07 24 – 13 16.00 TRUE
5 Wasps vs. Gloucester Mar 07 39 – 22 5.10 TRUE
6 Worcester Warriors vs. Northampton Saints Mar 07 10 – 16 0.80 FALSE


Predictions for Round 14

Here are the predictions for Round 14. The prediction is my estimated expected points difference with a positive margin being a win to the home team, and a negative margin a win to the away team.

Game Date Winner Prediction
1 Harlequins vs. Sale Sharks Aug 15 Sale Sharks -3.90
2 Worcester Warriors vs. Gloucester Aug 15 Gloucester -0.10
3 Exeter Chiefs vs. Leicester Tigers Aug 15 Exeter Chiefs 18.20
4 Bath vs. London Irish Aug 16 Bath 8.50
5 Bristol vs. Saracens Aug 16 Saracens -3.40
6 Northampton Saints vs. Wasps Aug 17 Northampton Saints 2.50


New COVID tests?

From NewsHub: Coronavirus: New test might detect COVID-19 in just a second, doesn’t involve nose swab.

They get points for a less positive headline than the Reuters original, but

The center said in an initial clinical trial involving hundreds of patients, the new artificial intelligence-based device identified evidence of the virus in the body at a 95 percent success rate.

As far as I can tell, the claim comes entirely from a press release — I haven’t been able to find any more data. What this implies is that Reuters (and NewsHub) don’t have any way to know what “a 95% success rate” actually means.

A COViD test can be wrong in two ways: it can miss actual infections or it can think there’s an infection when there isn’t.  In the New Zealand context, missing only 5% of infections would be doing well.  Thinking 5% of healthy people are infected would make the test useless. We’ve done roughly 500,000 COVID tests so far in New Zealand. If 5% were false positives, that would be 25,000 people incorrectly thought to be cases.

Also, it matters a lot when people are tested, and for what reason. Someone who is currently sick is  more likely to test positive than someone who is  infected but has not developed symptoms.  An initial clinical study will usually involve people whose infection status is known, leaving out  the more important and more difficult cases.

To be fair to the journalists, there’s expert comment in the story that makes some of these points

The amount of virus present in saliva increases as patients get sicker, he said, and a big challenge is to detect in “people who are borderline”.

“It will be a game changer only if we see validation of this technology against the current technology,” he said.

It might also be worth noting that the researcher in  question, Dr Eli Schwarz, has a previous example of overly-optimistic press releases during the pandemic. He is running a trial of the anti-parasite drug ivermectin, describing it as a possible cure.  Unfortunately, the Australian lab experiment that is said to support ivermectin use found that the drug destroyed the virus only at concentrations nearly five orders of magnitude higher than those being used in the trial.

August 11, 2020

Super Rugby Australia Predictions for Round 7

Team Ratings for Round 7

The basic method is described on my Department home page.
Here are the team ratings prior to this week’s games, along with the ratings at the start of the season.

Current Rating Rating at Season Start Difference
Brumbies 2.23 4.67 -2.40
Rebels -2.09 -5.52 3.40
Reds -2.81 -0.31 -2.50
Waratahs -4.81 -7.12 2.30
Force -10.81 -10.00 -0.80


Performance So Far

So far there have been 12 matches played, 9 of which were correctly predicted, a success rate of 75%.
Here are the predictions for last week’s games.

Please note that if you are checking back on my predictions, there is a different prediction of the points difference for the Rebels versus Brumbies game. I had not realised this was to be played at a neutral ground so gave the Rebels home ground advantage. I still had the Brumbies as winning so I still had the result wrong. I have changed the prediction now so I don’t mess up my ratings for future games.

At the moment it requires an amount of checking to ensure I have home ground advantage assignments correct in games played in Australia. That is particularly the case in the NRL with games played in Sydney.

Game Date Score Prediction Correct
1 Rebels vs. Brumbies Aug 07 30 – 12 -7.60 FALSE
2 Waratahs vs. Reds Aug 08 45 – 12 -1.90 FALSE


Predictions for Round 7

Here are the predictions for Round 7. The prediction is my estimated expected points difference with a positive margin being a win to the home team, and a negative margin a win to the away team.

Game Date Winner Prediction
1 Force vs. Waratahs Aug 14 Waratahs -6.00
2 Reds vs. Rebels Aug 15 Reds 3.80


Super Rugby Aotearoa Predictions for Round 10

Team Ratings for Round 10

The basic method is described on my Department home page.
Here are the team ratings prior to this week’s games, along with the ratings at the start of the season.

Current Rating Rating at Season Start Difference
Crusaders 14.77 15.15 -0.40
Hurricanes 8.45 8.31 0.10
Blues 7.61 5.39 2.20
Chiefs 4.21 7.94 -3.70
Highlanders 1.54 -0.22 1.80


Performance So Far

So far there have been 18 matches played, 13 of which were correctly predicted, a success rate of 72.2%.
Here are the predictions for last week’s games.

Game Date Score Prediction Correct
1 Hurricanes vs. Chiefs Aug 08 31 – 18 7.80 TRUE
2 Crusaders vs. Highlanders Aug 09 32 – 22 19.00 TRUE


Predictions for Round 10

Here are the predictions for Round 10. The prediction is my estimated expected points difference with a positive margin being a win to the home team, and a negative margin a win to the away team.

Game Date Winner Prediction
1 Highlanders vs. Hurricanes Aug 15 Hurricanes -2.40
2 Blues vs. Crusaders Aug 16 Crusaders -2.70


NRL Predictions for Round 14

Team Ratings for Round 14

The basic method is described on my Department home page.
Here are the team ratings prior to this week’s games, along with the ratings at the start of the season.

Current Rating Rating at Season Start Difference
Storm 14.27 12.73 1.50
Roosters 11.01 12.25 -1.20
Panthers 5.63 -0.13 5.80
Raiders 5.27 7.06 -1.80
Eels 5.11 2.80 2.30
Rabbitohs 3.02 2.85 0.20
Sharks 1.81 1.81 0.00
Knights -0.28 -5.92 5.60
Sea Eagles -1.36 1.05 -2.40
Wests Tigers -1.53 -0.18 -1.30
Dragons -3.89 -6.14 2.20
Warriors -5.70 -5.17 -0.50
Bulldogs -6.12 -2.52 -3.60
Cowboys -6.92 -3.95 -3.00
Broncos -10.65 -5.53 -5.10
Titans -11.65 -12.99 1.30


Performance So Far

So far there have been 104 matches played, 70 of which were correctly predicted, a success rate of 67.3%.
Here are the predictions for last week’s games.

Game Date Score Prediction Correct
1 Dragons vs. Roosters Aug 06 16 – 24 -13.60 TRUE
2 Sea Eagles vs. Warriors Aug 07 22 – 26 10.30 FALSE
3 Rabbitohs vs. Broncos Aug 07 28 – 10 15.20 TRUE
4 Storm vs. Bulldogs Aug 08 41 – 10 19.10 TRUE
5 Knights vs. Wests Tigers Aug 08 44 – 4 0.10 TRUE
6 Panthers vs. Raiders Aug 08 28 – 12 0.80 TRUE
7 Titans vs. Cowboys Aug 09 30 – 10 -5.00 FALSE
8 Sharks vs. Eels Aug 09 12 – 14 -1.10 TRUE


Predictions for Round 14

Here are the predictions for Round 14. The prediction is my estimated expected points difference with a positive margin being a win to the home team, and a negative margin a win to the away team.

Game Date Winner Prediction
1 Roosters vs. Storm Aug 13 Storm -1.30
2 Panthers vs. Warriors Aug 14 Panthers 15.80
3 Eels vs. Dragons Aug 14 Eels 11.00
4 Sharks vs. Titans Aug 15 Sharks 15.50
5 Cowboys vs. Rabbitohs Aug 15 Rabbitohs -7.90
6 Raiders vs. Broncos Aug 15 Raiders 17.90
7 Wests Tigers vs. Bulldogs Aug 16 Wests Tigers 6.60
8 Knights vs. Sea Eagles Aug 16 Knights 3.10


August 7, 2020

Briefly

  • Newshub has a story about so-called ‘lucky’ Lotto stores.  I’ll recycle a previous response.
  • The Productivity Commission are arguing that the extra week in lockdown was unnecessary and very expensive. Their analysis is wrong; it does not seem to consider whether and how much the extra week reduced the risk of needing a second lockdown, which was part of the reason for doing in.  I’m not saying the extra week was the right decision — you can’t tell, without modelling the extra risk, which they didn’t do.  It’s like saying insurance is not cost-effective because your house didn’t burn done. Insurance may or may not be cost-effective, but that isn’t how you tell.
  • Ed Yong at the Atlantic, on why there’s so much we don’t know about COVID immune response: Immunology Is Where Intuition Goes to Die
  • The Human Gene Nomenclature Committee has changed the names of a bunch of genes. Not because they’re named after unpleasant historical figures, but because Excel keeps trying to turn them into dates:  SEPT1, OCT4, MARCH1.  Spreadsheets are useful (and Excel is the world’s most popular statistical software), but you do need to keep a sharp eye on them
  • Newshub reports on an attempt to get Pharmac to pay for a drug that costs half a million dollars per patient per year.  I’ll outsource the basic statistical comparison to Matt Nippert on Twitter — the total cost would be about a quarter of Pharmac’s budget (and I’ll just note that this is slightly more than it spends on cancer.)
  • If you thought our Census had problems, look at the US.  The American Statistical Association and the American Association for Public Opinion Research are among the groups who want the data collection extended rather than shortened.