August 25, 2020

Super Rugby Australia Predictions for Round 9

Team Ratings for Round 9

The basic method is described on my Department home page.
Here are the team ratings prior to this week’s games, along with the ratings at the start of the season.

Current Rating Rating at Season Start Difference
Brumbies 3.34 4.67 -1.30
Reds 0.41 -0.31 0.70
Rebels -2.94 -5.52 2.60
Waratahs -4.96 -7.12 2.20
Force -14.14 -10.00 -4.10


Performance So Far

So far there have been 16 matches played, 13 of which were correctly predicted, a success rate of 81.2%.
Here are the predictions for last week’s games.

Game Date Score Prediction Correct
1 Reds vs. Force Aug 21 57 – 5 14.30 TRUE
2 Brumbies vs. Waratahs Aug 22 38 – 11 10.60 TRUE


Predictions for Round 9

Here are the predictions for Round 9. The prediction is my estimated expected points difference with a positive margin being a win to the home team, and a negative margin a win to the away team.

Game Date Winner Prediction
1 Brumbies vs. Force Aug 28 Brumbies 22.00
2 Waratahs vs. Rebels Aug 29 Waratahs 2.50


Rugby Premiership Predictions for Round 16

Team Ratings for Round 16

The basic method is described on my Department home page.
Here are the team ratings prior to this week’s games, along with the ratings at the start of the season.

Current Rating Rating at Season Start Difference
Exeter Chiefs 10.59 7.99 2.60
Saracens 7.10 9.34 -2.20
Sale Sharks 5.19 0.17 5.00
Wasps 2.39 0.31 2.10
Bristol 0.78 -2.77 3.60
Gloucester 0.13 0.58 -0.50
Bath 0.09 1.10 -1.00
Northampton Saints -0.26 0.25 -0.50
Harlequins -1.55 -0.81 -0.70
Leicester Tigers -4.29 -1.76 -2.50
Worcester Warriors -6.64 -2.69 -4.00
London Irish -7.32 -5.51 -1.80


Performance So Far

So far there have been 90 matches played, 58 of which were correctly predicted, a success rate of 64.4%.
Here are the predictions for last week’s games.

Game Date Score Prediction Correct
1 Sale Sharks vs. Exeter Chiefs Aug 22 22 – 32 0.30 FALSE
2 Gloucester vs. Bristol Aug 22 24 – 33 5.40 FALSE
3 Wasps vs. Worcester Warriors Aug 22 32 – 17 13.20 TRUE
4 Saracens vs. Harlequins Aug 22 38 – 24 13.00 TRUE
5 London Irish vs. Northampton Saints Aug 22 3 – 27 -0.20 TRUE
6 Leicester Tigers vs. Bath Aug 23 16 – 38 2.50 FALSE


Predictions for Round 16

Here are the predictions for Round 16. The prediction is my estimated expected points difference with a positive margin being a win to the home team, and a negative margin a win to the away team.

Game Date Winner Prediction
1 Wasps vs. Sale Sharks Aug 26 Wasps 1.70
2 Bristol vs. Exeter Chiefs Aug 26 Exeter Chiefs -5.30
3 Leicester Tigers vs. London Irish Aug 27 Leicester Tigers 7.50
4 Saracens vs. Gloucester Aug 27 Saracens 11.50
5 Worcester Warriors vs. Harlequins Aug 27 Harlequins -0.60
6 Northampton Saints vs. Bath Aug 27 Northampton Saints 4.20


Pro14 Predictions for Round 15

Team Ratings for Round 15

The basic method is described on my Department home page.
Here are the team ratings prior to this week’s games, along with the ratings at the start of the season.

Current Rating Rating at Season Start Difference
Leinster 16.08 12.20 3.90
Munster 10.34 10.73 -0.40
Glasgow Warriors 6.39 9.66 -3.30
Edinburgh 4.76 1.24 3.50
Ulster 4.14 1.89 2.20
Scarlets 2.53 3.91 -1.40
Connacht 1.14 2.68 -1.50
Cheetahs -0.46 -3.38 2.90
Cardiff Blues -0.47 0.54 -1.00
Ospreys -3.27 2.80 -6.10
Treviso -4.26 -1.33 -2.90
Dragons -7.40 -9.31 1.90
Zebre -14.61 -16.93 2.30
Southern Kings -14.92 -14.70 -0.20


Performance So Far

So far there have been 95 matches played, 72 of which were correctly predicted, a success rate of 75.8%.
Here are the predictions for last week’s games.

Game Date Score Prediction Correct
1 Treviso vs. Zebre Aug 22 13 – 17 16.90 FALSE
2 Scarlets vs. Cardiff Blues Aug 23 32 – 12 6.90 TRUE
3 Edinburgh vs. Glasgow Warriors Aug 23 15 – 30 4.80 FALSE
4 Leinster vs. Munster Aug 23 27 – 25 11.60 TRUE
5 Ospreys vs. Dragons Aug 23 20 – 20 10.00 FALSE
6 Connacht vs. Ulster Aug 24 26 – 20 1.10 TRUE


Predictions for Round 15

Here are the predictions for Round 15. The prediction is my estimated expected points difference with a positive margin being a win to the home team, and a negative margin a win to the away team.

Game Date Winner Prediction
1 Glasgow Warriors vs. Edinburgh Aug 29 Glasgow Warriors 6.60
2 Dragons vs. Scarlets Aug 30 Scarlets -4.90
3 Ulster vs. Leinster Aug 30 Leinster -6.90
4 Munster vs. Connacht Aug 31 Munster 14.20
5 Cardiff Blues vs. Ospreys Aug 31 Cardiff Blues 7.80
6 Zebre vs. Treviso Aug 31 Treviso -5.40


NRL Predictions for Round 16

Team Ratings for Round 16

The basic method is described on my Department home page.
Here are the team ratings prior to this week’s games, along with the ratings at the start of the season.

Current Rating Rating at Season Start Difference
Storm 14.06 12.73 1.30
Roosters 10.82 12.25 -1.40
Raiders 6.16 7.06 -0.90
Panthers 6.04 -0.13 6.20
Eels 5.46 2.80 2.70
Rabbitohs 4.00 2.85 1.20
Sharks 0.59 1.81 -1.20
Knights -0.11 -5.92 5.80
Wests Tigers -2.54 -0.18 -2.40
Sea Eagles -2.67 1.05 -3.70
Dragons -3.37 -6.14 2.80
Warriors -4.59 -5.17 0.60
Bulldogs -6.32 -2.52 -3.80
Cowboys -6.77 -3.95 -2.80
Broncos -11.05 -5.53 -5.50
Titans -11.72 -12.99 1.30


Performance So Far

So far there have been 120 matches played, 83 of which were correctly predicted, a success rate of 69.2%.
Here are the predictions for last week’s games.

Game Date Score Prediction Correct
1 Eels vs. Storm Aug 20 14 – 0 -8.70 FALSE
2 Panthers vs. Sharks Aug 21 38 – 12 5.50 TRUE
3 Broncos vs. Dragons Aug 21 24 – 28 -6.00 TRUE
4 Titans vs. Raiders Aug 22 16 – 36 -15.20 TRUE
5 Wests Tigers vs. Roosters Aug 22 16 – 38 -10.10 TRUE
6 Rabbitohs vs. Sea Eagles Aug 22 56 – 16 5.80 TRUE
7 Bulldogs vs. Warriors Aug 23 14 – 20 3.90 FALSE
8 Knights vs. Cowboys Aug 23 12 – 0 8.10 TRUE


Predictions for Round 16

Here are the predictions for Round 16. The prediction is my estimated expected points difference with a positive margin being a win to the home team, and a negative margin a win to the away team.

Game Date Winner Prediction
1 Eels vs. Rabbitohs Aug 27 Eels 3.50
2 Dragons vs. Titans Aug 28 Dragons 10.40
3 Roosters vs. Broncos Aug 28 Roosters 23.90
4 Knights vs. Warriors Aug 29 Knights 9.00
5 Sharks vs. Cowboys Aug 29 Sharks 9.40
6 Panthers vs. Wests Tigers Aug 29 Panthers 10.60
7 Storm vs. Sea Eagles Aug 30 Storm 16.70
8 Raiders vs. Bulldogs Aug 30 Raiders 14.50


August 24, 2020

A lanyard vs a piece of paper

Staged debate, as a format, has problems for actual discussion. So I wasn’t expecting the Stuff for/against on the COVID card to be more informative than the various discussions I’ve seen on Twitter.

This, from Ian Taylor was more than I’d anticipated, though

The Government has budgeted $210m for the 2023 census. That’s $210m to get a piece of paper to every New Zealander.

If you were a nasty suspicious person you might think I’ve quoted this out of context, and cut out all the things apart from the mail-out that go into making the value of the census over a billion dollars (PDF) — developing a sampling frame for dwellings, the hardware and software computer systems, data entry and validation,  monitoring of response rates, employing people to go door-to-door to catch up on non-response, the post-census enumeration survey, estimation of under-coverage, imputation of missing data, and so on.

You might think I’d left those out. But I didn’t. Describing the next Census as $210m to get a piece of paper to every New Zealander is like describing the COVID card as $100m to get a lanyard to every New Zealander. It leaves out all the stuff that makes it work.

And it’s not as if there aren’t other, more relevant, comparisons to make. A better comparison for the $100m cost of the COVID card would be the cost a of a few days more for Auckland at Level 3. If the COVID card could save us a week at level 3 in total, over the next couple of years, and there isn’t another solution that would be better or cheaper, then it easily makes sense.

I’m basically in favour of Bluetooth proximity measures as an adjunct to tracing in the current situation of mostly-successful elimination. I don’t think they come anywhere close to allowing us to relax the isolation/quarantine process, as some people had suggested earlier.

For the COVID card in particular I’d like to see some evidence about realistic fractions of people carrying the thing a year from now, and about how many false-positive ‘close contacts’ it generates. This information might exist, but it hasn’t been pushed by proponents. I’m not convinced by the opposing argument that it will take months to roll out:  the optimistic estimates for mass vaccination are probably eighteen months away; we’ve got plenty of time to improve. I think there are questions about cost and reliability and acceptability of COVID card relative to other Bluetooth and non-Bluetooth options, but I’ll leave them to the engineers and designers (preferably people who won’t simply dismiss any reluctance to wear the thing as ‘fashion’).  

The polling spectrum

I’ve had two people already complain to me on Twitter about the Stickybeak polling at The Spinoff. I’m a lot less negative than they are.

To start with, I think the really important distinction in surveys is between those that are actually trying to get the right answer, and those that aren’t.  Stickybeak are on the “are trying” side.

There’s also a distinction between studies that are really only making an effort to get internally-valid comparisons and those that are trying to match the population.  Internally-valid comparisons can still be useful: if you have a big self-selected internet sample you won’t learn much about what proportion of people take drugs, but you might be able learn how the proportion of cannabis users trying to cut down compares with the proportion of nicotine users trying to cut down, or whether people who smoke weed and drink beer do both at once or on separate days, or other useful things.

Stickybeak are clearly trying to get nationally representative estimates (at least for their overall political polling): they talk about reweighting to match census data by gender, age, and region, and their claimed secret sauce is chatbots to raise response rates for online surveys.

Now, just because you’re trying to get the right answer doesn’t mean you will. There are plenty of people who try to predict Lotto results or earthquakes, too.  And there, it’s too soon to say.  We know that online panels can give good answers: YouGov has done well with this technique, where their respondents are not necessarily representative, but they have a lot of information about them.   We’re also pretty sure that pure random sampling for political opinion doesn’t work any more; response rates are so low that either quota sampling or weighting is needed to make the sample look at all like the population.

So what do I think?  I would have hoped to see more variables used to reweight (ethnicity, and finer-scale geography), with total sample size larger, not smaller, than the traditional polls.  I’d also like to see a better uncertainty description. The Spinoff is quoting

For a random sample of this size and after accounting for weighting the maximum sampling error (using 95% confidence) is approximately ±4%.

The accounting for weighting is not always done by NZ pollsters, so that’s good to see, but ‘For a random sample of this size’ seems a bit evasive.  Either they’re claiming 4% is a good summary of the (maximum) sampling error for their results, in which case they should say so, or they aren’t, in which case they should stop hinting that it is.    Still, we know that the 3.1% error claimed by traditional pollsters is an underestimate, and they largely get a pass on it.

If you want to know whether to trust their results, I can’t tell you. Stickybeak are new enough that we don’t really know how accurate they are.

August 22, 2020

Causation and fair comparisons

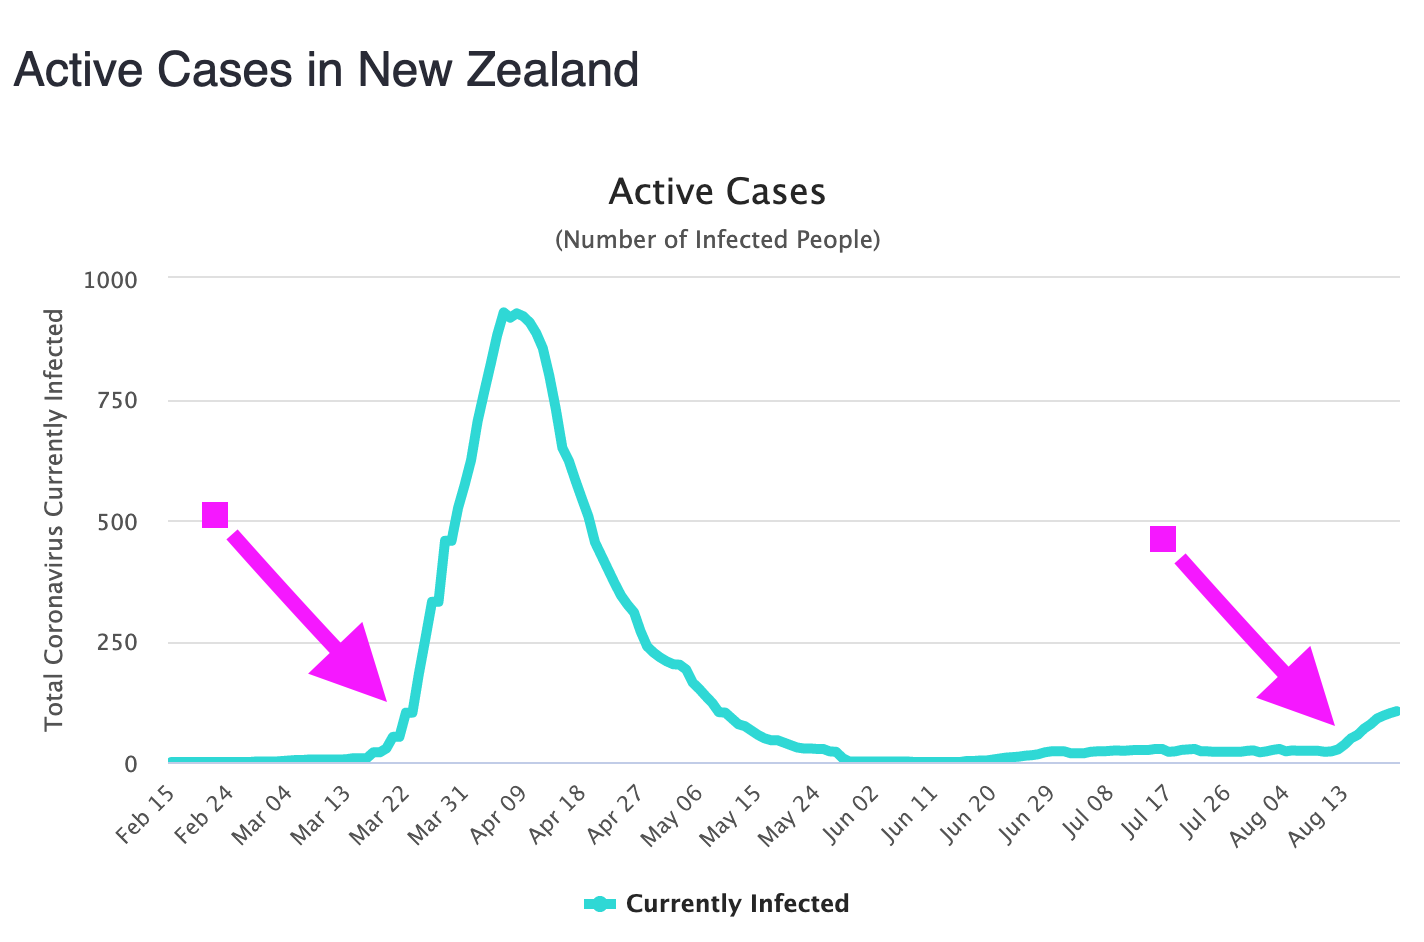
This is a version of a graph I saw on Twitter, posted by something who I think was trolling. The purple arrows are the lockdown decisions; the curve is the number of active COVID cases in New Zealand.  As you can see both lockdowns have been followed by a clear increase in the number of active cases, and no such increase has occurred any time when we haven’t imposed a lockdown. So, lockdowns cause COVID? Yeah nah.

Some of you are probably gearing up to say “correlation isn’t causation”; yes, well done. But that’s not the issue here. The relationship between number of active cases and lockdown is not a coincidence. There is a direct causal relationship. It just goes the other way: outbreaks cause lockdowns.

If we’re trying to estimate the effect of the California fires or the potential Gulf of Mexico hurricanes on COVID cases, it does make sense to compare infections shortly after and shortly before the event.  It obviously doesn’t for lockdown, but what (apart from “I know it when I see it”) is the distinction?

Economists would say the lockdown is endogenous (it’s coming from inside the epidemic). Epidemiologists, who have a more detailed taxonomy of bias, would talk about confounding by indication. People who take blood pressure drugs tend to have higher blood pressure than those who don’t; someone with  a headache is more likely to have taken paracetamol than someone without a headache. Interventions look bad precisely because you use them when they’re needed.  My bedroom tends to be warmer when the air conditioning is on (in summer) than when the heat pump is on (in winter).

We need a fair comparison to what actually happens after lockdown, and it isn’t business as usual.  This is where a model is useful.  We know roughly what happens to COVID case numbers with no intervention, because we have a fairly good mathematical model for how the disease spreads.  With no intervention, the number of new cases wouldn’t peak early and decline; it would keep going up.  With alternative, milder, interventions we’d need models on both sides of the comparison.  We have some data to validate the models, including genome sequencing to confirm which people were really infected as part of the same cluster, but the model does a lot of the work.

So, yes, we really can conclude that a New Zealand-style lockdown has worked.  This doesn’t mean it would work everywhere — just having the government say “lockdown” doesn’t do anything unless people cooperate — but the comparison to what we’d expect without it is evidence to say it worked here.

You get the same sort of problems in estimating the cost of lockdowns.  The cost compared to business as usual is relatively easy to estimate. That’s even a fair comparison for some policy questions: if we’re evaluating how much money it’s worth spending on infection control at the border, it’s a useful benchmark to know that a two-week Auckland lockdown won’t leave you much change out of a billion dollars.

But if you have an outbreak already and you want to estimate the cost of a lockdown compared to no lockdown, you can’t do a fair comparison to business as usual.  The economy will suffer during a prolonged outbreak: people will be reluctant to eat out or go to movies or rugby; jobs will be lost; less money will be available for spending.  Even before you add in the economic value of health, just the economic value of the economy will be down.  If you want to talk about the economic cost of the lockdown vs just letting the coronavirus run free, you need to do that comparison.  You can’t just compare to business as usual, any more than you can compare to business as usual and decide that lockdowns cause outbreaks.

August 21, 2020

Pro14 Predictions for Round 14

Team Ratings for Round 14

The basic method is described on my Department home page.
Here are the team ratings prior to this week’s games, along with the ratings at the start of the season.

Current Rating Rating at Season Start Difference
Leinster 16.52 12.20 4.30
Munster 9.90 10.73 -0.80
Glasgow Warriors 5.66 9.66 -4.00
Edinburgh 5.49 1.24 4.20
Ulster 4.58 1.89 2.70
Scarlets 1.98 3.91 -1.90
Connacht 0.70 2.68 -2.00
Cardiff Blues 0.08 0.54 -0.50
Cheetahs -0.46 -3.38 2.90
Ospreys -2.82 2.80 -5.60
Treviso -3.50 -1.33 -2.20
Dragons -7.85 -9.31 1.50
Southern Kings -14.92 -14.70 -0.20
Zebre -15.37 -16.93 1.60


Performance So Far

So far there have been 101 matches played, 69 of which were correctly predicted, a success rate of 68.3%.
Here are the predictions for last week’s games.

Game Date Score Prediction Correct
1 Dragons vs. Treviso Feb 16 25 – 37 2.20 FALSE


Predictions for Round 14

Here are the predictions for Round 14. The prediction is my estimated expected points difference with a positive margin being a win to the home team, and a negative margin a win to the away team.

Game Date Winner Prediction
1 Treviso vs. Zebre Aug 22 Treviso 16.90
2 Scarlets vs. Cardiff Blues Aug 23 Scarlets 6.90
3 Edinburgh vs. Glasgow Warriors Aug 23 Edinburgh 4.80
4 Leinster vs. Munster Aug 23 Leinster 11.60
5 Ospreys vs. Dragons Aug 23 Ospreys 10.00
6 Connacht vs. Ulster Aug 24 Connacht 1.10


August 19, 2020

Comparing two natural product Covid proposals

The Herald has a story headlined Pineapples could be key to treating virus about a proposed treatment for early COVID infection.  CNN (and various other sources) has a story about oleander extract† as a proposed treatment.

In both cases, the proposal is based on lab studies that have not be formally published, though the oleander one is available as a preprint.

More importantly, though, the Australian pineapple-based treatment is heading into proper clinical trials.  In lab tests it has been shown to disable the spike protein that the coronavirus uses for docking to cells.  A safety study is about to start, and has an entry in the ANZ clinical trial registry.  The treatment isn’t especially dangerous (it’s the enzyme that makes the inside of your mouth sore when you eat raw pineapple) but there’s no good data yet on the exact range of side-effects it is when squirted up your nose on a regular basis. If the side-effects aren’t too bad, the next step will presumably be a controlled trial looking at the effects on the virus, and then a larger controlled trial looking at whether it actually benefits the patients. That’s the usual testing procedure for new treatments.

The US oleander-based treatment† has lab test data showing it stops cells being infected. The manufacturer wants to get the drug into use rapidly, either in controlled trials or, if necessary, by calling it a ‘dietary supplement’† and evading drug approval rules.

In this case, the need for safety studies is obvious.  The data on viral replication in the lab looked at concentrations down to 0.05 mg/ml, or 50ng/ml. The lethal† blood concentration has been estimated as 10ng/ml.  A previous study of it as a cancer treatment saw ‘dose-limiting toxicities’ at about 2ng/ml — and this is ‘dose-limiting toxicity’ in the context of untreatable cancers, so it has to be pretty brutal.

There will obviously be some low enough dose that’s safe, but there’s currently not the slightest reason to expect those low doses to be effective. You should want lab studies at plausible human doses, and probably animal studies, before you tried giving this to patients, and before you tried advertising it to the President of the United States and the broader public.


† Do not eat/drink/smoke oleander. It will kill you unpleasantly.

August 18, 2020

Super Rugby Australia Predictions for Round 8

Team Ratings for Round 8

The basic method is described on my Department home page.
Here are the team ratings prior to this week’s games, along with the ratings at the start of the season.

Current Rating Rating at Season Start Difference
Brumbies 2.23 4.67 -2.40
Reds -1.95 -0.31 -1.60
Rebels -2.94 -5.52 2.60
Waratahs -3.84 -7.12 3.30
Force -11.78 -10.00 -1.80


Performance So Far

So far there have been 14 matches played, 11 of which were correctly predicted, a success rate of 78.6%.
Here are the predictions for last week’s games.

Game Date Score Prediction Correct
1 Force vs. Waratahs Aug 14 8 – 28 -6.00 TRUE
2 Reds vs. Rebels Aug 15 19 – 3 3.80 TRUE


Predictions for Round 8

Here are the predictions for Round 8. The prediction is my estimated expected points difference with a positive margin being a win to the home team, and a negative margin a win to the away team.

Game Date Winner Prediction
1 Reds vs. Force Aug 21 Reds 14.30
2 Brumbies vs. Waratahs Aug 22 Brumbies 10.60