October 6, 2020

Mitre 10 Cup Predictions for Round 5

Team Ratings for Round 5

The basic method is described on my Department home page.
Here are the team ratings prior to this week’s games, along with the ratings at the start of the season.

Current Rating Rating at Season Start Difference
Tasman 13.94 15.13 -1.20
Auckland 8.13 6.75 1.40
Canterbury 7.84 8.40 -0.60
Wellington 7.33 6.47 0.90
Bay of Plenty 4.33 8.21 -3.90
Waikato 3.12 1.31 1.80
North Harbour 1.89 2.87 -1.00
Hawke’s Bay 1.64 0.91 0.70
Taranaki -4.12 -4.42 0.30
Otago -4.99 -4.03 -1.00
Northland -6.79 -8.71 1.90
Counties Manukau -9.13 -8.18 -1.00
Southland -10.11 -14.04 3.90
Manawatu -12.96 -10.57 -2.40


Performance So Far

So far there have been 28 matches played, 17 of which were correctly predicted, a success rate of 60.7%.
Here are the predictions for last week’s games.

Game Date Score Prediction Correct
1 Bay of Plenty vs. Auckland Oct 02 16 – 20 -0.20 TRUE
2 Counties Manukau vs. Manawatu Oct 03 36 – 30 7.00 TRUE
3 Northland vs. Taranaki Oct 03 35 – 25 -1.20 FALSE
4 Canterbury vs. Wellington Oct 03 31 – 26 3.10 TRUE
5 North Harbour vs. Tasman Oct 04 40 – 24 -12.50 FALSE
6 Southland vs. Waikato Oct 04 9 – 10 -11.70 TRUE
7 Otago vs. Hawke’s Bay Oct 04 9 – 28 -1.30 TRUE


Predictions for Round 5

Here are the predictions for Round 5. The prediction is my estimated expected points difference with a positive margin being a win to the home team, and a negative margin a win to the away team.

Game Date Winner Prediction
1 Manawatu vs. Canterbury Oct 09 Canterbury -17.80
2 Taranaki vs. Auckland Oct 10 Auckland -9.20
3 Wellington vs. Otago Oct 10 Wellington 15.30
4 Waikato vs. Counties Manukau Oct 10 Waikato 15.20
5 North Harbour vs. Hawke’s Bay Oct 11 North Harbour 3.30
6 Tasman vs. Bay of Plenty Oct 11 Tasman 12.60
7 Northland vs. Southland Oct 11 Northland 6.30


October 5, 2020

Auckland is bigger than Wellington

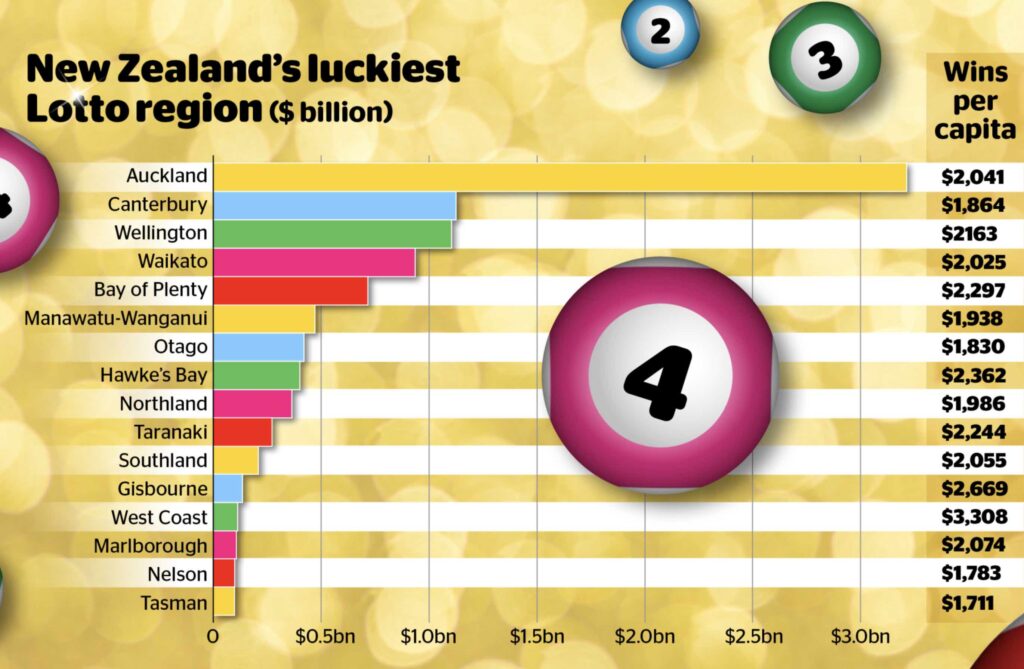
There’s a long interactive in the Herald prompted by the 2000th Lotto draw, earlier this week.  Among other interesting things, it has a graph of purporting to show the ‘luckiest’ regions

Aucklanders have won more money in Lotto prizes than any other region — roughly three times as much as either Canterbury or Wellington. By an amazing coincidence, Auckland has roughly three times the population of Canterbury or Wellington.  The bar chart is only showing population. Auckland is not punching above its weight.

Wins per capita are over on the side, and are much less variable. Some of this will be that people in different regions play Lotto more or less ofter; some probably was luck. It’s possible that some variation is due to strategy — not variation in whether you win, but in how much.

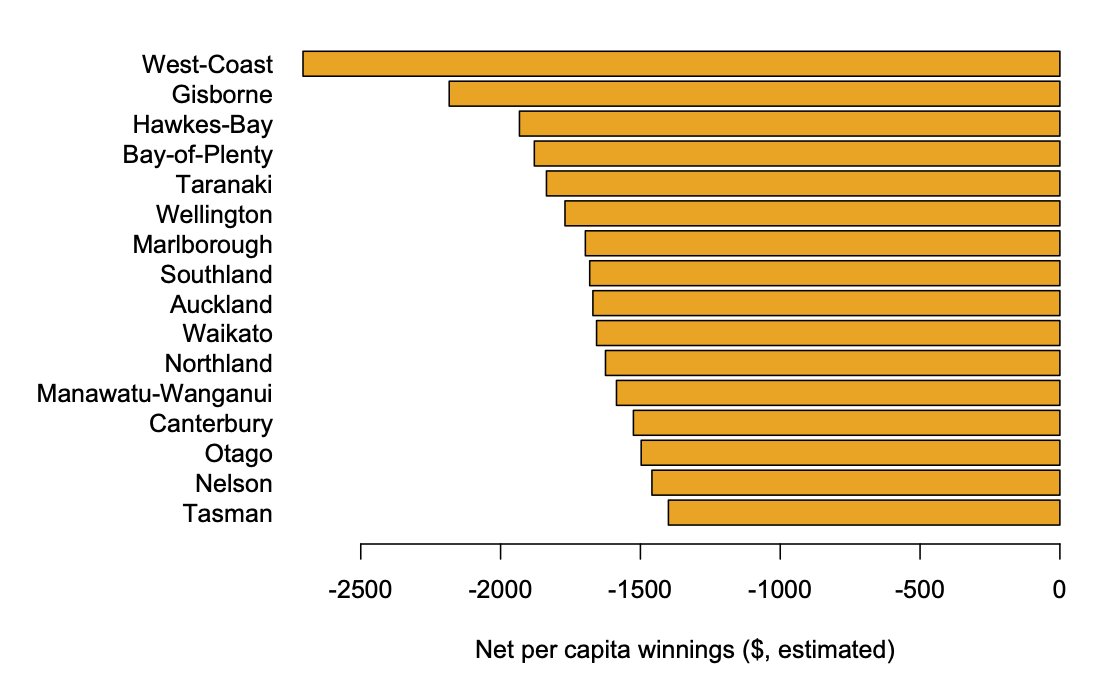
Perhaps more importantly, the ‘wins per capita’ figure is gross winnings, not net winnings.   Lotto NZ didn’t release details of expenditures, but 2000 draws is a long enough period of time that we can work with averages and get a rough estimate.  As the Herald reports, about 55c in the dollar goes in prizes, so the gross winnings will average about 55% of revenue and the net winnings will average -45% of revenue, or -9/11 times gross winnings.

So: as an estimate over the past 2000 draws, the ‘luckiest’ NZ regions


Some of the smaller regions are probably misrepresented here by good/bad luck — if Lotto NZ released actual data on revenue by region I’d be happy to do a more precise version

Auckland outbreak: the genomes

Marc Daalder at newsroom has a very good piece about genome sequencing and its role in handling the Auckland outbreak.

One thing I want to highlight is this family tree. It’s the B.1.1.1 clade of the virus, a particular viral subfamily

The samples from the Auckland outbreak are that blue/green cluster at the top. They’re all more closely related to each other than to any other sample that has been sequenced in NZ or anywhere else in the world, so we know they had a recent common ancestor: the virus that started the outbreak.

I’m mentioning this because I saw discussion on Twitter over the past month or so of the ‘B.1.1.1 clade’ and whether there had been other earlier cases from that clade in NZ and whether that meant the government was hiding something.  B.1.1.1 is a pretty broad family, going back to a common ancestor in late February.   If two samples are from different broad clades, they are different incursions to NZ, but if they’re from the same broad clade they aren’t necessarily the same incursion. You need the full sequence to say how closely viruses are related.

September 29, 2020

NRL Predictions for Finals Week 1

Team Ratings for Finals Week 1

The basic method is described on my Department home page.
Here are the team ratings prior to this week’s games, along with the ratings at the start of the season.

Current Rating Rating at Season Start Difference
Storm 13.50 12.73 0.80
Roosters 10.89 12.25 -1.40
Panthers 8.92 -0.13 9.10
Raiders 6.96 7.06 -0.10
Rabbitohs 6.41 2.85 3.60
Eels 2.38 2.80 -0.40
Sharks -0.56 1.81 -2.40
Knights -1.82 -5.92 4.10
Warriors -1.84 -5.17 3.30
Wests Tigers -3.07 -0.18 -2.90
Sea Eagles -4.77 1.05 -5.80
Dragons -4.95 -6.14 1.20
Titans -7.22 -12.99 5.80
Bulldogs -7.62 -2.52 -5.10
Cowboys -8.05 -3.95 -4.10
Broncos -11.16 -5.53 -5.60


Performance So Far

So far there have been 160 matches played, 109 of which were correctly predicted, a success rate of 68.1%.
Here are the predictions for last week’s games.

Game Date Score Prediction Correct
1 Broncos vs. Cowboys Sep 24 32 – 16 -2.90 FALSE
2 Titans vs. Knights Sep 25 36 – 6 -6.40 FALSE
3 Rabbitohs vs. Roosters Sep 25 60 – 8 -6.70 FALSE
4 Bulldogs vs. Panthers Sep 26 0 – 42 -12.00 TRUE
5 Sharks vs. Raiders Sep 26 28 – 38 -4.80 TRUE
6 Wests Tigers vs. Eels Sep 26 24 – 28 -5.80 TRUE
7 Sea Eagles vs. Warriors Sep 27 28 – 40 3.10 FALSE
8 Dragons vs. Storm Sep 27 30 – 22 -18.80 FALSE


Predictions for Finals Week 1

Here are the predictions for Finals Week 1. The prediction is my estimated expected points difference with a positive margin being a win to the home team, and a negative margin a win to the away team.

Game Date Winner Prediction
1 Panthers vs. Roosters Oct 02 Panthers 0.00
2 Raiders vs. Sharks Oct 03 Raiders 9.50
3 Storm vs. Eels Oct 03 Storm 11.10
4 Rabbitohs vs. Knights Oct 04 Rabbitohs 10.20


Mitre 10 Cup Predictions for Round 4

Team Ratings for Round 4

The basic method is described on my Department home page.
Here are the team ratings prior to this week’s games, along with the ratings at the start of the season.

Current Rating Rating at Season Start Difference
Tasman 15.67 15.13 0.50
Auckland 7.81 6.75 1.10
Canterbury 7.65 8.40 -0.80
Wellington 7.52 6.47 1.10
Bay of Plenty 4.65 8.21 -3.60
Waikato 3.87 1.31 2.60
Hawke’s Bay 0.49 0.91 -0.40
North Harbour 0.16 2.87 -2.70
Taranaki -3.34 -4.42 1.10
Otago -3.84 -4.03 0.20
Northland -7.58 -8.71 1.10
Counties Manukau -9.02 -8.18 -0.80
Southland -10.86 -14.04 3.20
Manawatu -13.07 -10.57 -2.50


Performance So Far

So far there have been 21 matches played, 12 of which were correctly predicted, a success rate of 57.1%.
Here are the predictions for last week’s games.

Game Date Score Prediction Correct
1 Wellington vs. Bay of Plenty Sep 25 32 – 10 3.50 TRUE
2 Tasman vs. Waikato Sep 26 34 – 17 14.20 TRUE
3 Southland vs. North Harbour Sep 26 11 – 10 -9.50 FALSE
4 Hawke’s Bay vs. Canterbury Sep 26 20 – 19 -5.10 FALSE
5 Auckland vs. Manawatu Sep 27 50 – 12 21.70 TRUE
6 Taranaki vs. Otago Sep 27 19 – 30 5.70 FALSE
7 Counties Manukau vs. Northland Sep 27 15 – 24 3.20 FALSE


Predictions for Round 4

Here are the predictions for Round 4. The prediction is my estimated expected points difference with a positive margin being a win to the home team, and a negative margin a win to the away team.

Game Date Winner Prediction
1 Bay of Plenty vs. Auckland Oct 02 Auckland -0.20
2 Counties Manukau vs. Manawatu Oct 03 Counties Manukau 7.00
3 Northland vs. Taranaki Oct 03 Taranaki -1.20
4 Canterbury vs. Wellington Oct 03 Canterbury 3.10
5 North Harbour vs. Tasman Oct 04 Tasman -12.50
6 Southland vs. Waikato Oct 04 Waikato -11.70
7 Otago vs. Hawke’s Bay Oct 04 Hawke’s Bay -1.30


September 22, 2020

NRL Predictions for Round 20


Team Ratings for Round 20

The basic method is described on my Department home page.
Here are the team ratings prior to this week’s games, along with the ratings at the start of the season.

Current Rating Rating at Season Start Difference
Storm 14.68 12.73 1.90
Roosters 13.01 12.25 0.80
Panthers 7.63 -0.13 7.80
Raiders 6.62 7.06 -0.40
Rabbitohs 4.29 2.85 1.40
Eels 2.56 2.80 -0.20
Sharks -0.22 1.81 -2.00
Knights -0.33 -5.92 5.60
Warriors -2.61 -5.17 2.60
Wests Tigers -3.25 -0.18 -3.10
Sea Eagles -4.00 1.05 -5.00
Dragons -6.13 -6.14 0.00
Bulldogs -6.33 -2.52 -3.80
Cowboys -7.14 -3.95 -3.20
Titans -8.70 -12.99 4.30
Broncos -12.07 -5.53 -6.50


Performance So Far

So far there have been 152 matches played, 106 of which were correctly predicted, a success rate of 69.7%.
Here are the predictions for last week’s games.

Game Date Score Prediction Correct
1 Rabbitohs vs. Bulldogs Sep 17 16 – 26 14.90 FALSE
2 Cowboys vs. Panthers Sep 18 12 – 32 -11.80 TRUE
3 Eels vs. Broncos Sep 18 26 – 12 17.10 TRUE
4 Sea Eagles vs. Titans Sep 19 24 – 42 9.10 FALSE
5 Storm vs. Wests Tigers Sep 19 50 – 22 16.70 TRUE
6 Roosters vs. Sharks Sep 19 34 – 18 15.00 TRUE
7 Raiders vs. Warriors Sep 20 26 – 14 14.10 TRUE
8 Knights vs. Dragons Sep 20 42 – 18 6.10 TRUE


Predictions for Round 20

Here are the predictions for Round 20. The prediction is my estimated expected points difference with a positive margin being a win to the home team, and a negative margin a win to the away team.

Game Date Winner Prediction
1 Broncos vs. Cowboys Sep 24 Cowboys -2.90
2 Titans vs. Knights Sep 25 Knights -6.40
3 Rabbitohs vs. Roosters Sep 25 Roosters -6.70
4 Bulldogs vs. Panthers Sep 26 Panthers -12.00
5 Sharks vs. Raiders Sep 26 Raiders -4.80
6 Wests Tigers vs. Eels Sep 26 Eels -5.80
7 Sea Eagles vs. Warriors Sep 27 Sea Eagles 3.10
8 Dragons vs. Storm Sep 27 Storm -18.80


Mitre 10 Cup Predictions for Round 3

Team Ratings for Round 3

The basic method is described on my Department home page.
Here are the team ratings prior to this week’s games, along with the ratings at the start of the season.

Current Rating Rating at Season Start Difference
Tasman 15.39 15.13 0.30
Canterbury 8.11 8.40 -0.30
Auckland 6.74 6.75 -0.00
Wellington 6.32 6.47 -0.10
Bay of Plenty 5.84 8.21 -2.40
Waikato 4.14 1.31 2.80
North Harbour 0.90 2.87 -2.00
Hawke’s Bay 0.02 0.91 -0.90
Taranaki -2.24 -4.42 2.20
Otago -4.94 -4.03 -0.90
Counties Manukau -8.18 -8.18 -0.00
Northland -8.42 -8.71 0.30
Southland -11.60 -14.04 2.40
Manawatu -12.00 -10.57 -1.40


Performance So Far

So far there have been 14 matches played, 9 of which were correctly predicted, a success rate of 64.3%.
Here are the predictions for last week’s games.

Game Date Score Prediction Correct
1 Tasman vs. Northland Sep 18 54 – 21 25.70 TRUE
2 Waikato vs. North Harbour Sep 19 41 – 19 3.90 TRUE
3 Canterbury vs. Taranaki Sep 19 22 – 23 15.50 FALSE
4 Bay of Plenty vs. Southland Sep 19 17 – 14 23.00 TRUE
5 Hawke’s Bay vs. Counties Manukau Sep 20 31 – 17 10.60 TRUE
6 Manawatu vs. Otago Sep 20 25 – 36 -2.90 TRUE
7 Auckland vs. Wellington Sep 20 21 – 39 6.40 FALSE


Predictions for Round 3

Here are the predictions for Round 3. The prediction is my estimated expected points difference with a positive margin being a win to the home team, and a negative margin a win to the away team.

Game Date Winner Prediction
1 Wellington vs. Bay of Plenty Sep 25 Wellington 3.50
2 Tasman vs. Waikato Sep 26 Tasman 14.20
3 Southland vs. North Harbour Sep 26 North Harbour -9.50
4 Hawke’s Bay vs. Canterbury Sep 26 Canterbury -5.10
5 Auckland vs. Manawatu Sep 27 Auckland 21.70
6 Taranaki vs. Otago Sep 27 Taranaki 5.70
7 Counties Manukau vs. Northland Sep 27 Counties Manukau 3.20


September 20, 2020

Chloroquine trial exaggerations

Q: Did you see hydroxychloroquine is back?

A: No

Q: In the Herald (blamed on news.com.au) Hydroxychloroquine: Divisive drug may hold secrets to stopping Covid-19‘ and ‘Covid 19 coronavirus: Hydroxychloroquine: The drug that could be our saviour‘. What’s the news?

A: There’s a new Australian trial in healthcare workers, to see if taking the drug before you get exposed will protect you  from infection — previously there had only been evidence that it doesn’t help  if you take it when you’re already sick.

Q:  And what were the results?

A: There aren’t any results. There won’t be any results for quite a while.

Q: When?

A: The entry at the Clinical Trials Registry says they plan to finish taking measurements at the end of the year, and the story says the results will be in by January.  Though  the Trials  Registry also  says they plan to recruit 2250 people and follow them for four months, and the story says they have ‘roughly 200’ people now. So it’s not completely clear.

Q: Will it work?

A: We don’t know. That’s the point of the trial.   We know it’s nowhere near 100%  effective,  because people taking hydroxychloroquine for auto-immune diseases have  ended up with COVID, but it’s possible that it provides some useful level of protection. It’s also very possible that it doesn’t.

Q: And healthcare workers are at high risk, so it would be most useful for them?

A: Yes, and healthcare workers are already trying to do all the other protective things, and they are still at high risk, so the drug might be a useful addition even if it’s only moderately effective

Q: And for the rest of us?

A: It’s unlikely to be as safe or effective as masks.

Q: If it does work, it will be pity that the politicisation has slowed it down

A: Well and the fact that it doesn’t work after you get sick. But yes, that’s one of the points the story makes, quoting both the lead researcher and a study participant

Q: This is the story that’s illustrated with a picture of Donald Trump?

A:  <sigh>

Q: Apart from the headline and picture, the story is ok?

A: Well, later on, one of the researchers says

“For example if there was a case in a meatworks or an aged care, you’d go there and give the drug to all the residents or workers to try to prevent them getting Covid-19,” he said.

Q: But how is that before they’re exposed? If there’s a diagnosed case, they’ve already exposed people and they will be isolated in the future and not expose anyone else. It’s the people who are already exposed that are the problem.

A: I hope he’s just saying there’s a potential for using it as post-exposure prophylaxis in the future, after a different trial

Q: That … could have been clearer.

A:  And the biggest problems for healthcare workers in the current Australian outbreak seem to have been a shortage of protective equipment or poor ventilation, so you’d hope irresponsible news headlines about a miracle cure wouldn’t distract from that.

September 18, 2020

Vaccine transparency

Moderna (big long PDF) and Pfizer (big long  PDF) have released their clinical trial protocols.  These specify how  to run the trial: the statistical design, and also a lot of other things  like how  they collect adverse events. There’s a story at Reuters and at Buzzfeed. I’m not the right person to  comment about the detailed collection of safety data, except to say that they do describe how they do it,  so you can ask your favourite immunologist or virologist for an opinion.

The statistical design of early stopping is reasonable in both trials, as you’d hope. Both trials will end up declaring a positive result with an estimated vaccine efficacy  greater than 0.5, and with  0.3 efficacy outside the margin of error.   If the true efficacy is 0.6 they have a  90% chance of  declaring a positive result.

They vary in how they place their bets for the case where the vaccine is more effective than that — and it might be, who  knows?.  If the vaccine is actually 90% effective, you don’t need to test it on as many people, and the urgency of knowing it works is greater. The trials are designed so  they can stop early, but still preserve their overall standards for statistical evidence.

The tradeoff for stopping  earlier is that you have less detailed  information: you  know the vaccine is  good, but you have less precise estimates of how good, and you have somewhat less safety information because you’ve vaccinated fewer people or followed them for less time.  There is an important and nerdy statistical literature on the  pros and cons of basically any possible set of guidelines for stopping early. If you’re interested, this is a good starting place.

Moderna designed their trial more or less the way I would have done, with the so-called O’Brien-Fleming guidelines, which are standard and pretty conservative about early stopping. Pfizer are less conservative: if the vaccine is very effective, they have more chance of  stopping early.   But while they are less conservative, the design is still well in the  range of standard custom and practice.

We still don’t have any idea what the results will be at the early analyses, either for effectiveness or safety.  We don’t know what the US  government will decide to do with the results. But we do know that if the trials follow their protocols, and if the trials stop early, and if there aren’t  prohibitive safety concerns, then we will have good  evidence that  the vaccine works.   We  also will be able to tell if  the companies or  the FDA or anyone changes the standards of evidence after seeing the results.


September 16, 2020

Undetected COVID cases?

The Herald

Researchers from the Australian National University have now developed a new test which picks up previous Covid-19 infection in a patient’s blood

The study indicates eight in 3000 healthy and previously undiagnosed Australians had likely been infected with the virus.

“This suggests that instead of 11,000 cases we know about from nasal swab testing, about 70,000 people had been exposed overall,” Associate Professor Ian Cockburn said.

We had a few of these ‘seroprevalence’ studies a while back. If you’re trying to estimate a proportion as low as 8 in 3000 from a sample, you need a representative sample and you need a test with a false-positive rate that you know is much lower than 8 in 3000.

Let’s look at the preprint:

You don’t need to download the PDF,  just skimming the abstract will tell you how they got the 3000 people, and what the uncertainty is:

 We used this assay to assess the frequency of virus-specific antibodies in a cohort of elective surgery patients in Australia and estimated seroprevalence in Australia to be 0.28% (0 to 0.72%)

Emphasis added: the uncertainty interval goes all the way down to  zero.   In contrast to some of the earlier seroprevalence studies, they seem to have done the analysis right, but I’m not convinced that people getting  surgery are a representative sample — they certainly aren’t a random sample.

If you do click through the PDF, the Discussion section says it even more clearly

Here we report results from the first large scale seroprevalence survey in Australia. We estimate a seroprevalence of 0.28%, which–given a population estimate for Australia of 25.50 million individuals — equates to 71,400 infections(95% CI: 0 to 181,050).

It’s actually pretty impressive  that the test is as good as it is, but it’s still not really up to the challenge of providing reliable evidence on the number of people exposed to Covid in Australia.