October 20, 2020

Super Rugby Unlocked Predictions for Round 2

Team Ratings for Round 2

The basic method is described on my Department home page.
Here are the team ratings prior to this week’s games, along with the ratings at the start of the season.

Current Rating Rating at Season Start Difference
Sharks 3.27 4.01 -0.70
Stormers 1.00 1.00 0.00
Bulls -1.99 -1.45 -0.50
Lions -4.08 -4.82 0.70
Cheetahs -8.82 -10.00 1.20
Griquas -9.46 -10.00 0.50
Pumas -11.18 -10.00 -1.20


Performance So Far

So far there have been 3 matches played, 3 of which were correctly predicted, a success rate of 100%.
Here are the predictions for last week’s games.

Game Date Score Prediction Correct
1 Sharks vs. Lions Oct 17 19 – 16 13.30 TRUE
2 Cheetahs vs. Pumas Oct 18 53 – 31 4.50 TRUE
3 Bulls vs. Griquas Oct 18 30 – 23 13.10 TRUE


Predictions for Round 2

Here are the predictions for Round 2. The prediction is my estimated expected points difference with a positive margin being a win to the home team, and a negative margin a win to the away team.

Game Date Winner Prediction
1 Cheetahs vs. Bulls Oct 10 Bulls -2.30
2 Griquas vs. Pumas Oct 11 Griquas 6.20
3 Stormers vs. Lions Oct 11 Stormers 9.60


Super Rugby Unlocked Predictions for Round 1

Team Ratings for Round 1

Another competition where I missed the start. I am surprised my South African readers didn’t alert me, or perhaps it crept up on them. I had been checking on whether the Currie Cup would be running but hadn’t got wind of this competition.

As before when I have missed the start, for completeness I will post my predictions for the games missed.

Note that there are difficulties with this competition due to the presence of three teams without recent Super Rugby results. I have followed my usual practice of assigning a rating of -10 in such cases. (As was done with the Force in Super Rugby Australia for example.)

The basic method is described on my Department home page.
Here are the team ratings prior to this week’s games, along with the ratings at the start of the season.

Current Rating Rating at Season Start Difference
Sharks 4.01 4.01 0.00
Stormers 1.00 1.00 0.00
Bulls -1.45 -1.45 0.00
Lions -4.82 -4.82 0.00
Cheetahs -10.00 -10.00 0.00
Griquas -10.00 -10.00 0.00
Pumas -10.00 -10.00 0.00


Predictions for Round 1

Here are the predictions for Round 1. The prediction is my estimated expected points difference with a positive margin being a win to the home team, and a negative margin a win to the away team.

Game Date Winner Prediction
1 Sharks vs. Lions Oct 17 Sharks 13.30
2 Cheetahs vs. Pumas Oct 18 Cheetahs 4.50
3 Bulls vs. Griquas Oct 18 Bulls 13.10


NRL Predictions for the Grand Final

Team Ratings for the Grand Final

The basic method is described on my Department home page.
Here are the team ratings prior to this week’s games, along with the ratings at the start of the season.

Current Rating Rating at Season Start Difference
Storm 14.32 12.73 1.60
Roosters 10.25 12.25 -2.00
Panthers 9.10 -0.13 9.20
Rabbitohs 7.73 2.85 4.90
Raiders 6.98 7.06 -0.10
Eels 1.68 2.80 -1.10
Sharks -0.76 1.81 -2.60
Warriors -1.84 -5.17 3.30
Knights -2.61 -5.92 3.30
Wests Tigers -3.07 -0.18 -2.90
Sea Eagles -4.77 1.05 -5.80
Dragons -4.95 -6.14 1.20
Titans -7.22 -12.99 5.80
Bulldogs -7.62 -2.52 -5.10
Cowboys -8.05 -3.95 -4.10
Broncos -11.16 -5.53 -5.60


Performance So Far

So far there have been 168 matches played, 116 of which were correctly predicted, a success rate of 69%.
Here are the predictions for last week’s games.

Game Date Score Prediction Correct
1 Storm vs. Raiders Oct 16 30 – 10 5.90 TRUE
2 Panthers vs. Rabbitohs Oct 17 20 – 16 3.20 TRUE


Predictions for the Grand Final

Here are the predictions for the Grand Final. The prediction is my estimated expected points difference with a positive margin being a win to the home team, and a negative margin a win to the away team.

Game Date Winner Prediction
1 Panthers vs. Storm Oct 25 Storm -3.20


Mitre 10 Cup Predictions for Round 7

Team Ratings for Round 7

The basic method is described on my Department home page.
Here are the team ratings prior to this week’s games, along with the ratings at the start of the season.

Current Rating Rating at Season Start Difference
Tasman 13.29 15.13 -1.80
Auckland 9.08 6.75 2.30
Canterbury 7.68 8.40 -0.70
Wellington 6.22 6.47 -0.20
Waikato 4.31 1.31 3.00
North Harbour 3.87 2.87 1.00
Bay of Plenty 3.76 8.21 -4.40
Hawke’s Bay 0.17 0.91 -0.70
Taranaki -3.15 -4.42 1.30
Otago -3.26 -4.03 0.80
Northland -7.50 -8.71 1.20
Southland -10.24 -14.04 3.80
Counties Manukau -10.36 -8.18 -2.20
Manawatu -13.77 -10.57 -3.20


Performance So Far

So far there have been 42 matches played, 28 of which were correctly predicted, a success rate of 66.7%.
Here are the predictions for last week’s games.

Game Date Score Prediction Correct
1 Hawke’s Bay vs. Northland Oct 16 33 – 17 9.70 TRUE
2 Manawatu vs. Bay of Plenty Oct 17 35 – 53 -13.90 TRUE
3 Auckland vs. Tasman Oct 17 31 – 10 -4.30 FALSE
4 Southland vs. Taranaki Oct 17 9 – 17 -3.40 TRUE
5 Canterbury vs. Waikato Oct 18 15 – 16 7.60 FALSE
6 Otago vs. Counties Manukau Oct 18 40 – 22 8.80 TRUE
7 Wellington vs. North Harbour Oct 18 25 – 20 5.40 TRUE


Predictions for Round 7

Here are the predictions for Round 7. The prediction is my estimated expected points difference with a positive margin being a win to the home team, and a negative margin a win to the away team.

Game Date Winner Prediction
1 Otago vs. Northland Oct 23 Otago 7.20
2 Bay of Plenty vs. Canterbury Oct 24 Canterbury -0.90
3 Hawke’s Bay vs. Manawatu Oct 24 Hawke’s Bay 16.90
4 North Harbour vs. Auckland Oct 24 Auckland -2.20
5 Counties Manukau vs. Wellington Oct 25 Wellington -13.60
6 Tasman vs. Southland Oct 25 Tasman 26.50
7 Waikato vs. Taranaki Oct 25 Waikato 10.50


October 19, 2020

How did the polls do?

There were two (or possibly three) features of the preliminary election results on Saturday being discussed as surprising: the large Labour margin, the win in Auckland Central by Chlöe Swarbrick of the Green Party, and possibly the win in Waiariki by Rawiri Waititi of the Māori Party.  How do these really compare to pre-election polling? I’m going to use Peter Ellis’s poll aggregator, to save having to think about it myself. It’s an obviously sensible approach and has done well in the past.

To start with, I do want to point out that the polls got the broad message correct,  in a way that you would probably not be able to do just by listening to the news and doomscrolling on social media.  The polls said that Labour would do much better than in 2017, and that ACT would do much better than in 2017 and that National would do much worse, and that the miscellaneous new parties would go the way of most miscellaneous new parties.  It’s the details that were off.

In the aggregated polls, Labour were expected to get 59 seats, plus or minus about 3, and National about 42 with similar uncertainties.  In reality, Labour are at 64 and National at 35, way out in the tail of the predictions.  Even taking the uncertainty in the model into account, Labour did surprisingly well.   The predictions for  ACT and NZ First, on the other hand, were spot-on, and for the Greens were well within the predicted range.

In Auckland Central I know of two electorate polls, which had  Chlöe Swarbrick at 24% and 26% — the latter taken 24-30 September, very close to the start of voting.  In reality, she got 34.1% and, if history can be trusted, is likely to move up slightly on special votes.  This wasn’t a straightforward swing away from National; the Labour candidate also did better in polls than in the election. It will be interesting to see if much of Swarbrick’s performance can be explained by improved turnout when we have the final numbers.

Single-electorate polling is always hard, and it’s likely to be even harder for an electorate with a young population that includes many students, and for a three-way race. Hard-to-predict electorates, though, are the only ones where polling is interesting.  Given that two polls were both off by 10+% for the winning candidate, single-electorate polling may just not be worth the effort.

By contrast, I don’t think the Waiariki result should really be surprising — the polling was indicating a good chance of one or two electorates for the Māori Party, and I’m told that people in Māori media had discussed it as plausible.

So why were the polls off nationally? It doesn’t help that the number of polling companies has fallen, but that would be incorporated in the model uncertainty, so it doesn’t explain everything.  Some of it is probably just 2020. Because opinion polls get a low response rate — and worse, a response rate that’s lower for some groups of people than others — pollers have to have ways to correct for the bias.  On top of that, they need ways to estimate who will actually vote in the election.  Given the huge change in people’s working patterns this year, and especially during August and September in Auckland, it would not be even slightly surprising if the relationship between political views and responding to an opinion poll had changed.

In the future, as things settle down, polling companies will be able to adapt to the new normal and get more accurate results (or at least better estimates of error). For now, though, polls may be working less well than they have in the past.
October 18, 2020

‘Close’ counts in horseshoes and clinical trials

Elections are designed  to  produce a  result: someone wins. The losing side doesn’t get to enact a fair share of their program just for getting close.

Clinical trials aren’t like that.  They do feed into regulatory decisions, which may be  yes/no in a similar way, but when we talk about what was learned in a trial it isn’t just binary, or shouldn’t be.  Unfortunately, there’s a tendency for “the trial did not provide convincing evidence of mortality  reductions” to get simplified to “the trial did not provide any evidence of  mortality reductions”  and then to  “the treatment  does not reduce mortality”.

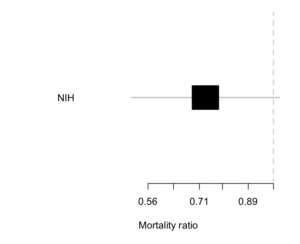
The NIH trial of remdesivir for Covid was a typical example. Here’s the result.

The estimated reduction is about 25% — not a cure, but quite worthwhile if true.  There’s a lot of uncertainty: the trial data are consistent with there being no benefit (a ratio of 1; the vertical line) and equally consistent with a 50% mortality reduction.  The results still got described as “remdesivir does not reduce mortality”.

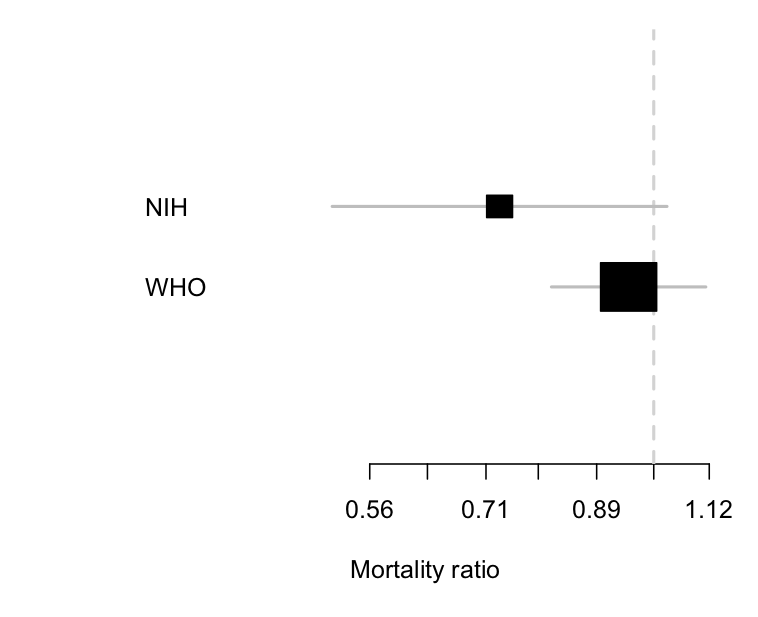
This matters, because we need to distinguish an inconclusive but moderately favourable result from the other sort of negative trial. This week we got results from the larger  SOLIDARITY trial, coordinated by  the WHO.  Here’s a comparison of the two

The two trials are clearly consistent with each other, but the uncertainty around the results is a lot smaller with the WHO  trial.  Importantly,  the estimated  benefit in the WHO trial is a much less impressive 5% reduction, and the lower limit is about 20%.  The WHO trial can reasonably be summarised as  saying ‘there is no substantial reduction in mortality with remdesivir’, and it wouldn’t be too much of a stretch to say ‘remdesivir doesn’t reduce mortality’  (in patients similar to these ones).

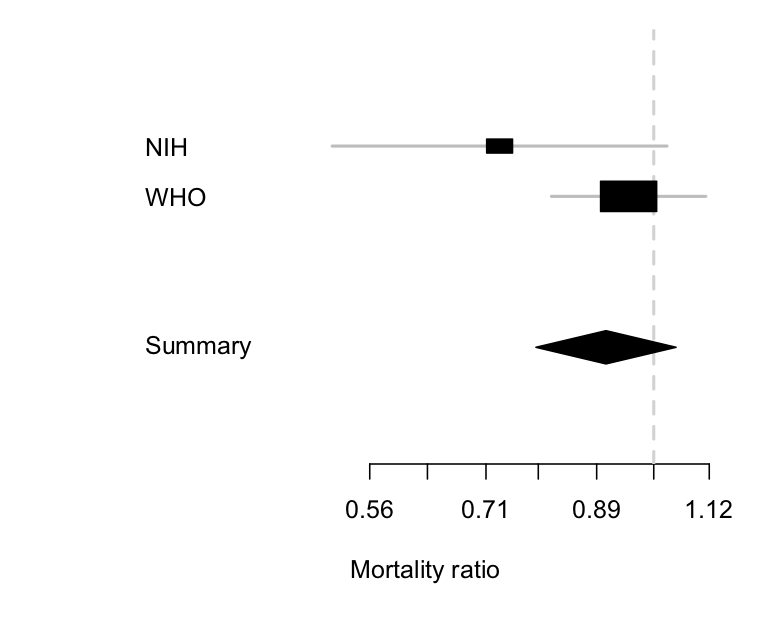
We can combine the two sets of information:

The  diamond is the uncertainty interval for the combination of the two trials (it’s a different shape so you  don’t think it’s a third trial).  It mostly follows the larger WHO trial, where most of the information is, but it’s shifted a little to the left because of the more positive information from the NIH trial.  The takeaway point is the same as from just the WHO trial, though: remdesivir doesn’t reduce mortality much, if at all.

October 13, 2020

Rugby Premiership Predictions for the Final

Team Ratings for the Final

The basic method is described on my Department home page.
Here are the team ratings prior to this week’s games, along with the ratings at the start of the season.

Current Rating Rating at Season Start Difference
Wasps 8.78 0.31 8.50
Exeter Chiefs 8.09 7.99 0.10
Sale Sharks 6.91 0.17 6.70
Saracens 6.51 9.34 -2.80
Bristol 2.96 -2.77 5.70
Bath 2.89 1.10 1.80
Harlequins -0.67 -0.81 0.10
Gloucester -0.72 0.58 -1.30
Northampton Saints -3.94 0.25 -4.20
Worcester Warriors -6.74 -2.69 -4.10
Leicester Tigers -7.87 -1.76 -6.10
London Irish -9.98 -5.51 -4.50


Performance So Far

So far there have been 132 matches played, 88 of which were correctly predicted, a success rate of 66.7%.
Here are the predictions for last week’s games.

Game Date Score Prediction Correct
1 Exeter Chiefs vs. Bath Oct 11 35 – 6 7.50 TRUE
2 Wasps vs. Bristol Oct 11 47 – 24 8.80 TRUE


Predictions for the Final

Here are the predictions for the Final. The prediction is my estimated expected points difference with a positive margin being a win to the home team, and a negative margin a win to the away team.

Game Date Winner Prediction
1 Exeter Chiefs vs. Wasps Oct 25 Wasps -0.70


Pro14 Predictions for Round 3

Team Ratings for Round 3

The basic method is described on my Department home page.
Here are the team ratings prior to this week’s games, along with the ratings at the start of the season.

Current Rating Rating at Season Start Difference
Leinster 16.34 16.52 -0.20
Munster 9.59 9.90 -0.30
Glasgow Warriors 5.70 5.66 0.00
Edinburgh 4.97 5.49 -0.50
Ulster 4.79 4.58 0.20
Scarlets 1.58 1.98 -0.40
Cardiff Blues 0.81 0.08 0.70
Connacht 0.29 0.70 -0.40
Cheetahs -0.46 -0.46 0.00
Ospreys -2.37 -2.82 0.40
Treviso -3.08 -3.50 0.40
Dragons -8.33 -7.85 -0.50
Zebre -14.90 -15.37 0.50
Southern Kings -14.92 -14.92 0.00


Performance So Far

So far there have been 12 matches played, 10 of which were correctly predicted, a success rate of 83.3%.
Here are the predictions for last week’s games.

Game Date Score Prediction Correct
1 Dragons vs. Zebre Oct 10 26 – 18 14.20 TRUE
2 Treviso vs. Leinster Oct 11 25 – 37 -13.10 TRUE
3 Ospreys vs. Ulster Oct 11 12 – 24 0.40 FALSE
4 Cardiff Blues vs. Connacht Oct 11 29 – 7 5.80 TRUE
5 Munster vs. Edinburgh Oct 11 25 – 23 12.00 TRUE
6 Glasgow Warriors vs. Scarlets Oct 12 20 – 7 10.10 TRUE


Predictions for Round 3

Here are the predictions for Round 3. The prediction is my estimated expected points difference with a positive margin being a win to the home team, and a negative margin a win to the away team.

Game Date Winner Prediction
1 Leinster vs. Zebre Oct 24 Leinster 37.70
2 Treviso vs. Scarlets Oct 24 Treviso 1.80
3 Ospreys vs. Glasgow Warriors Oct 25 Glasgow Warriors -1.60
4 Ulster vs. Dragons Oct 26 Ulster 19.60
5 Edinburgh vs. Connacht Oct 26 Edinburgh 11.20
6 Munster vs. Cardiff Blues Oct 27 Munster 15.30


NRL Predictions for the Preliminary Finals

Team Ratings for the Preliminary Finals

The basic method is described on my Department home page.
Here are the team ratings prior to this week’s games, along with the ratings at the start of the season.

Current Rating Rating at Season Start Difference
Storm 13.59 12.73 0.90
Roosters 10.25 12.25 -2.00
Panthers 9.02 -0.13 9.20
Rabbitohs 7.81 2.85 5.00
Raiders 7.70 7.06 0.60
Eels 1.68 2.80 -1.10
Sharks -0.76 1.81 -2.60
Warriors -1.84 -5.17 3.30
Knights -2.61 -5.92 3.30
Wests Tigers -3.07 -0.18 -2.90
Sea Eagles -4.77 1.05 -5.80
Dragons -4.95 -6.14 1.20
Titans -7.22 -12.99 5.80
Bulldogs -7.62 -2.52 -5.10
Cowboys -8.05 -3.95 -4.10
Broncos -11.16 -5.53 -5.60


Performance So Far

So far there have been 166 matches played, 114 of which were correctly predicted, a success rate of 68.7%.
Here are the predictions for last week’s games.

Game Date Score Prediction Correct
1 Roosters vs. Raiders Oct 09 18 – 22 5.60 FALSE
2 Eels vs. Rabbitohs Oct 10 24 – 38 -2.90 TRUE


Predictions for the Preliminary Finals

Here are the predictions for the Preliminary Finals. The prediction is my estimated expected points difference with a positive margin being a win to the home team, and a negative margin a win to the away team.

Game Date Winner Prediction
1 Storm vs. Raiders Oct 16 Storm 5.90
2 Panthers vs. Rabbitohs Oct 17 Panthers 3.20


Mitre 10 Cup Predictions for Round 6

Team Ratings for Round 6

The basic method is described on my Department home page.
Here are the team ratings prior to this week’s games, along with the ratings at the start of the season.

Current Rating Rating at Season Start Difference
Tasman 14.85 15.13 -0.30
Canterbury 8.31 8.40 -0.10
Auckland 7.53 6.75 0.80
Wellington 6.26 6.47 -0.20
North Harbour 3.83 2.87 1.00
Waikato 3.69 1.31 2.40
Bay of Plenty 3.43 8.21 -4.80
Hawke’s Bay -0.30 0.91 -1.20
Taranaki -3.52 -4.42 0.90
Otago -3.92 -4.03 0.10
Northland -7.03 -8.71 1.70
Counties Manukau -9.70 -8.18 -1.50
Southland -9.88 -14.04 4.20
Manawatu -13.44 -10.57 -2.90


Performance So Far

So far there have been 35 matches played, 23 of which were correctly predicted, a success rate of 65.7%.
Here are the predictions for last week’s games.

Game Date Score Prediction Correct
1 Manawatu vs. Canterbury Oct 09 10 – 34 -17.80 TRUE
2 Taranaki vs. Auckland Oct 10 28 – 29 -9.20 TRUE
3 Wellington vs. Otago Oct 10 34 – 35 15.30 FALSE
4 Waikato vs. Counties Manukau Oct 10 36 – 13 15.20 TRUE
5 North Harbour vs. Hawke’s Bay Oct 11 46 – 10 3.30 TRUE
6 Tasman vs. Bay of Plenty Oct 11 33 – 7 12.60 TRUE
7 Northland vs. Southland Oct 11 18 – 14 6.30 TRUE


Predictions for Round 6

Here are the predictions for Round 6. The prediction is my estimated expected points difference with a positive margin being a win to the home team, and a negative margin a win to the away team.

Game Date Winner Prediction
1 Hawke’s Bay vs. Northland Oct 16 Hawke’s Bay 9.70
2 Manawatu vs. Bay of Plenty Oct 17 Bay of Plenty -13.90
3 Auckland vs. Tasman Oct 17 Tasman -4.30
4 Southland vs. Taranaki Oct 17 Taranaki -3.40
5 Canterbury vs. Waikato Oct 18 Canterbury 7.60
6 Otago vs. Counties Manukau Oct 18 Otago 8.80
7 Wellington vs. North Harbour Oct 18 Wellington 5.40