October 11, 2021

Vaccine percentages

A few assorted issues:

First, the denominator questions — not the question of the actual population of NZ, which Henry Cooke is in charge of, but the eligibility and ethnicity questions.

Should we be quoting vaccination as a percentage of those eligible or as a percentage of the population? Yes, both. They answer two different important questions.  There’s a question of epidemic dynamics: are we getting to a point where enough people are vaccinated for Delta to be controllable more easily? What’s relevant there is vaccination as a percentage of the population; kids still count as unvaccinated, even though they aren’t eligible. There’s also a social question: are we providing the right access, information, and incentives to get people vaccinated? What’s relevant there is vaccination as a percentage of those eligible.

Next, ethnicity. I’ve seen people asking how ethnicity is counted in the MoH reports. Most of the NZ government tries to count people according to all the ethnicities they identify with — you can be in multiple categories. As a result, the categories add up to more than 100% of the population. The Ministry of Health does something different. If you give them multiple ethnicities, they pick one.  They prioritise: you’re Māori if that’s one of your ethnicities; you’re Pacific if that’s one of your ethnicities and Māori isn’t; you’re Asian if that’s one of your ethnicities and Māori and Pacific both aren’t, and so on. The advantage of this is that subgroups add up nicely: the number of vaccinations overall is the sum  of the numbers in each ethnic group. The disadvantage is that you may not be in the group or groups you expect.

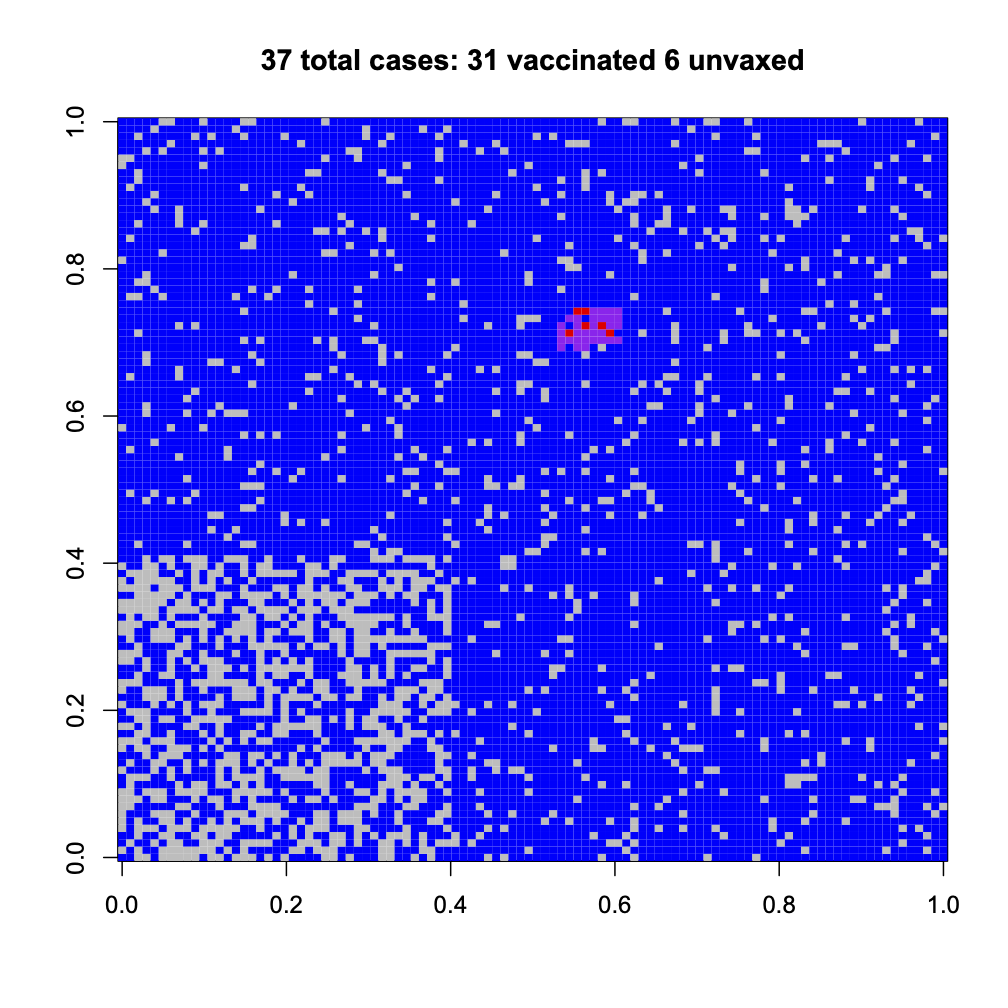
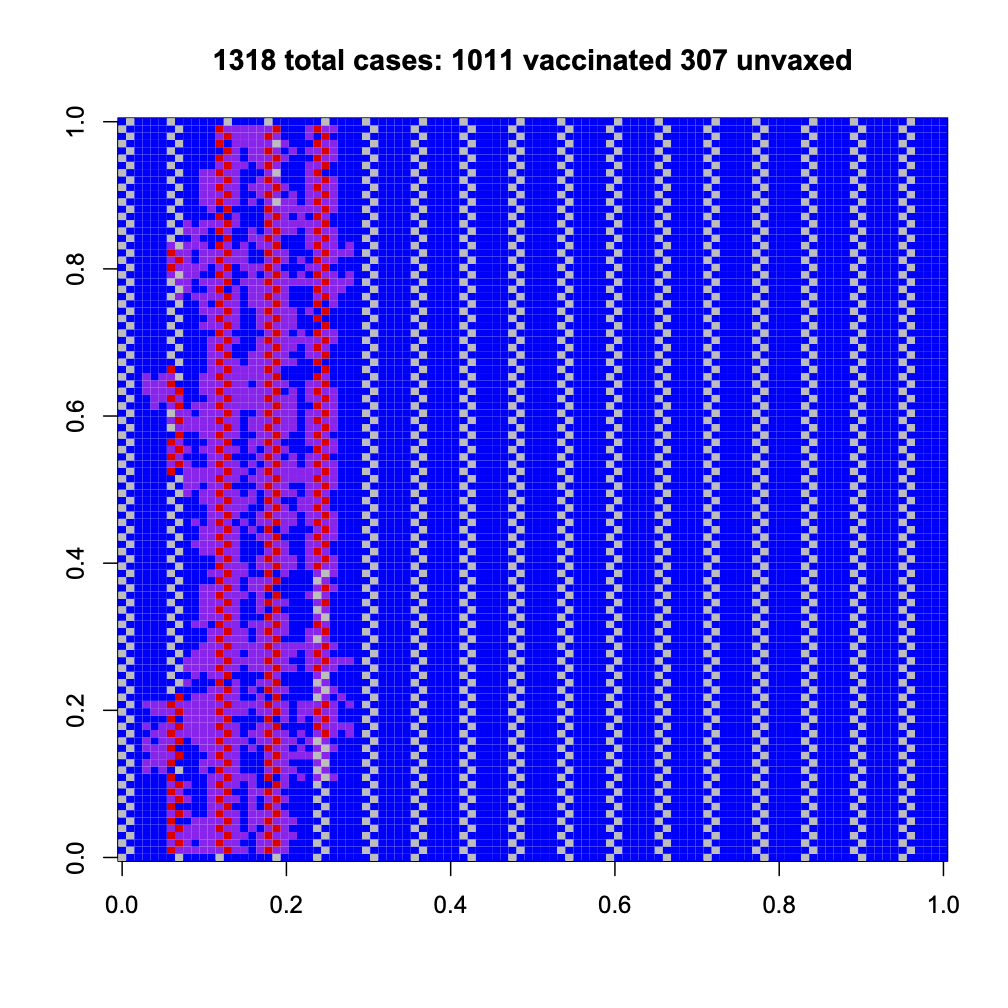
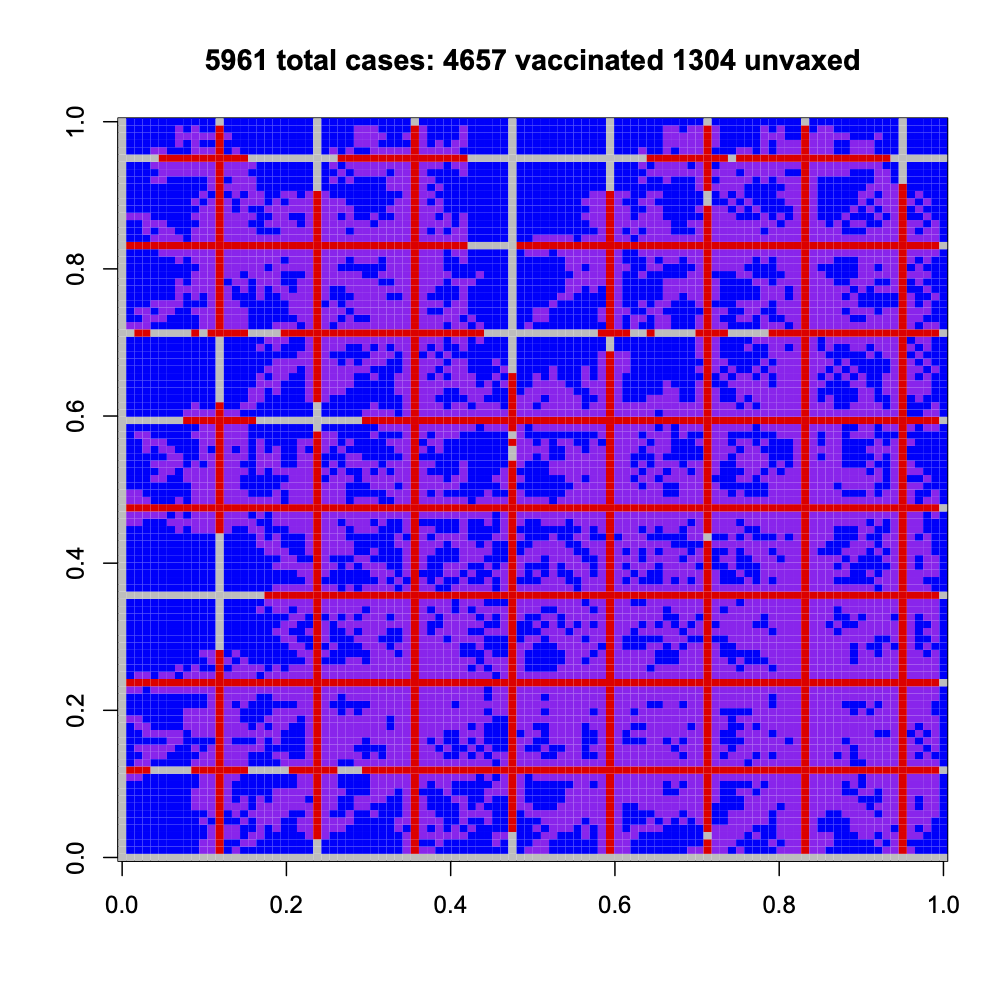
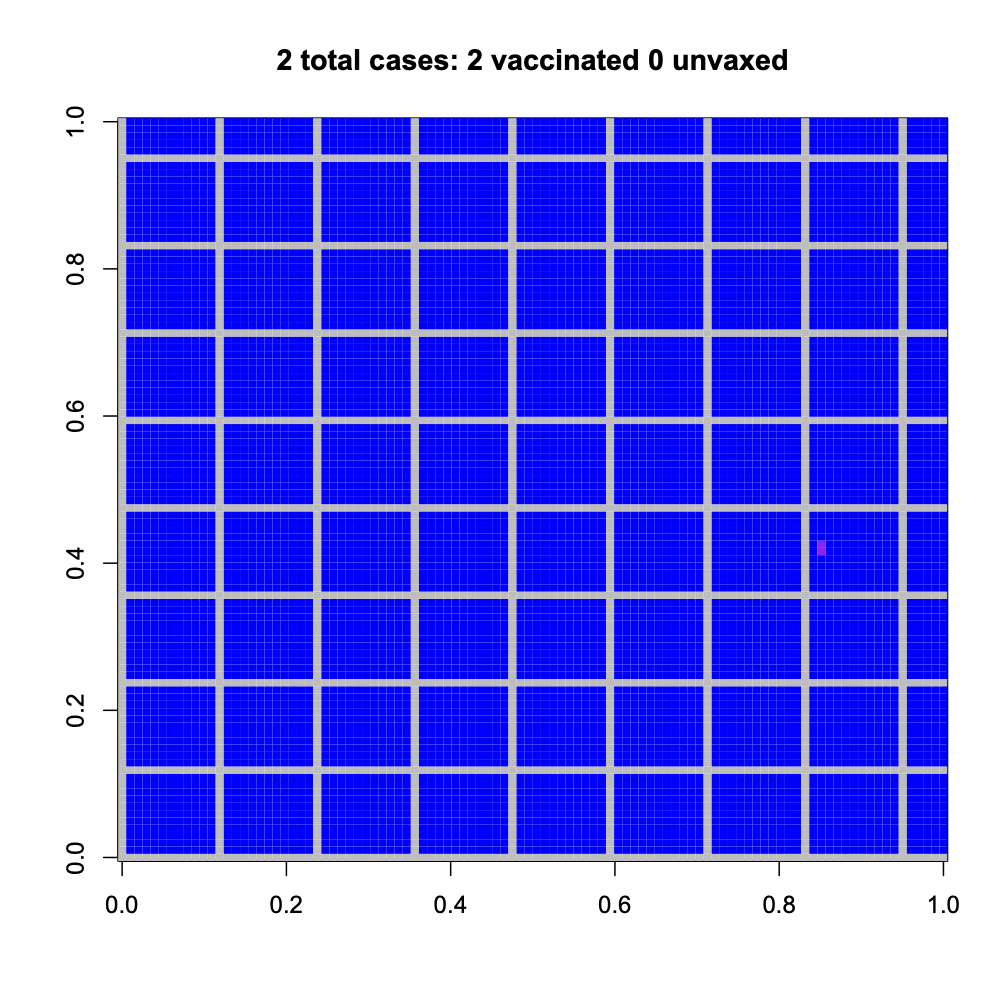
Finally, pictures like this (this one is from @farmgeek on Twitter)

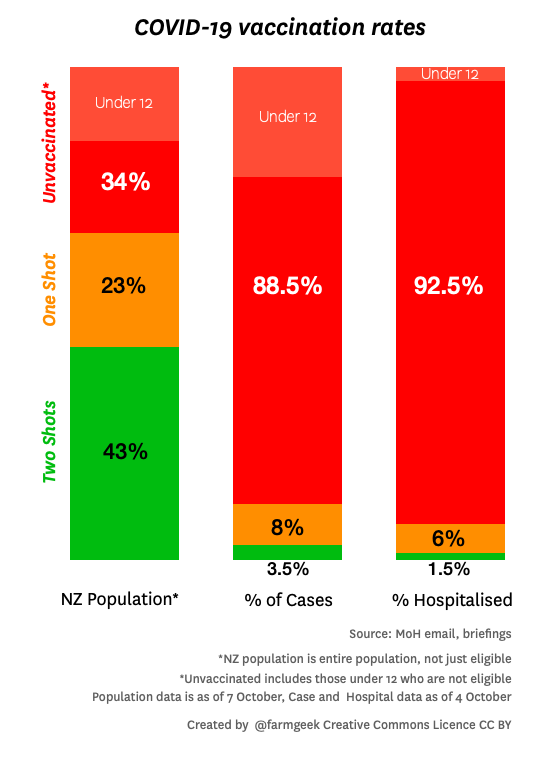
This is aiming to show the protective effect of vaccines. It’s a lot better than just reporting the % vaccinated among cases or hospitalised cases, because it shows the denominator.  The ratio of the red:green ratios in two bars is an estimate of one aspect of vaccine effectiveness; you can see it’s big.

It’s not a perfect estimate, for two reasons. The first is differences in exposure. If people who are unvaccinated are also more likely to be exposed, the vaccine will look more effective than it is; if people who are unvaccinated are less likely to be exposed the vaccine will look less effective than it is.  Both of these are likely: vaccination and exposure is broadly higher in Auckland than in the rest of the country, but within Auckland vaccination is  higher in areas where exposure is probably lower.

On top of any differences in exposure, a graph like this underestimates the impact of the vaccine because it misses out the reduction in unvaccinated cases due to the vaccine. Getting vaccinated protects you, but as the vaccination rates slowly rise, getting vaccinated also increasingly protects other people, regardless of their vaccination status.  Measles is a good example here: vaccinated people are almost never hospitalised for measles, because the vaccine protects us, but very few unvaccinated people are hospitalised for measles because community vaccination levels slow the outbreaks down enough for testing and tracing to control them.

October 5, 2021

United Rugby Championship Predictions for Week 3

Team Ratings for Week 3

The basic method is described on my Department home page.
Here are the team ratings prior to this week’s games, along with the ratings at the start of the season.

Current Rating Rating at Season Start Difference
Leinster 14.60 14.79 -0.20
Munster 11.20 10.69 0.50
Ulster 7.95 7.41 0.50
Glasgow 4.04 3.69 0.40
Edinburgh 2.24 2.90 -0.70
Connacht 2.14 1.72 0.40
Bulls 1.97 3.65 -1.70
Ospreys 0.91 0.94 -0.00
Cardiff Rugby 0.69 -0.11 0.80
Scarlets 0.51 -0.77 1.30
Stormers 0.01 0.00 0.00
Sharks -0.74 -0.07 -0.70
Lions -3.83 -3.91 0.10
Benetton -4.21 -4.50 0.30
Dragons -6.24 -6.92 0.70
Zebre -15.19 -13.47 -1.70


Performance So Far

So far there have been 16 matches played, 15 of which were correctly predicted, a success rate of 93.8%.
Here are the predictions for last week’s games.

Game Date Score Prediction Correct
1 Connacht vs. Bulls Oct 02 34 – 7 4.50 TRUE
2 Scarlets vs. Lions Oct 02 36 – 13 9.40 TRUE
3 Benetton vs. Edinburgh Oct 02 28 – 27 -0.20 FALSE
4 Dragons vs. Leinster Oct 02 6 – 7 -15.90 TRUE
5 Glasgow vs. Sharks Oct 03 35 – 24 11.30 TRUE
6 Zebre vs. Ulster Oct 03 3 – 36 -14.80 TRUE
7 Munster vs. Stormers Oct 03 34 – 18 18.10 TRUE
8 Ospreys vs. Cardiff Rugby Oct 03 18 – 14 5.50 TRUE


Predictions for Week 3

Here are the predictions for Week 3. The prediction is my estimated expected points difference with a positive margin being a win to the home team, and a negative margin a win to the away team.

Game Date Winner Prediction
1 Ospreys vs. Sharks Oct 09 Ospreys 8.10
2 Ulster vs. Benetton Oct 09 Ulster 18.70
3 Leinster vs. Zebre Oct 09 Leinster 36.30
4 Glasgow vs. Lions Oct 10 Glasgow 14.40
5 Connacht vs. Dragons Oct 10 Connacht 14.90
6 Edinburgh vs. Stormers Oct 10 Edinburgh 8.70
7 Cardiff Rugby vs. Bulls Oct 10 Cardiff Rugby 5.20
8 Scarlets vs. Munster Oct 10 Munster -4.20


Top 14 Predictions for Round 6

Team Ratings for Round 6

The basic method is described on my Department home page.
Here are the team ratings prior to this week’s games, along with the ratings at the start of the season.

Current Rating Rating at Season Start Difference
Stade Toulousain 8.04 6.83 1.20
La Rochelle 6.63 6.78 -0.20
Bordeaux-Begles 6.19 5.42 0.80
Racing-Metro 92 6.13 6.13 -0.00
Lyon Rugby 4.86 4.15 0.70
Clermont Auvergne 4.38 5.09 -0.70
Montpellier 1.37 -0.01 1.40
RC Toulonnais 1.22 1.82 -0.60
Castres Olympique 0.71 0.94 -0.20
Stade Francais Paris -0.22 1.20 -1.40
Section Paloise -1.67 -2.25 0.60
Brive -2.75 -3.19 0.40
Biarritz -3.16 -2.78 -0.40
USA Perpignan -4.36 -2.78 -1.60


Performance So Far

So far there have been 35 matches played, 26 of which were correctly predicted, a success rate of 74.3%.
Here are the predictions for last week’s games.

Game Date Score Prediction Correct
1 Brive vs. Stade Francais Paris Oct 02 19 – 12 3.60 TRUE
2 Lyon Rugby vs. Bordeaux-Begles Oct 02 15 – 20 5.90 FALSE
3 Montpellier vs. La Rochelle Oct 02 21 – 11 0.30 TRUE
4 USA Perpignan vs. Section Paloise Oct 02 14 – 29 5.10 FALSE
5 Biarritz vs. Stade Toulousain Oct 03 11 – 17 -4.60 TRUE
6 Castres Olympique vs. RC Toulonnais Oct 03 27 – 16 5.40 TRUE
7 Clermont Auvergne vs. Racing-Metro 92 Oct 04 26 – 17 4.30 TRUE


Predictions for Round 6

Here are the predictions for Round 6. The prediction is my estimated expected points difference with a positive margin being a win to the home team, and a negative margin a win to the away team.

Game Date Winner Prediction
1 Biarritz vs. Lyon Rugby Oct 10 Lyon Rugby -1.50
2 Bordeaux-Begles vs. Montpellier Oct 10 Bordeaux-Begles 11.30
3 La Rochelle vs. Castres Olympique Oct 10 La Rochelle 12.40
4 Racing-Metro 92 vs. USA Perpignan Oct 10 Racing-Metro 92 17.00
5 Stade Francais Paris vs. Clermont Auvergne Oct 10 Stade Francais Paris 1.90
6 Stade Toulousain vs. Section Paloise Oct 10 Stade Toulousain 16.20
7 RC Toulonnais vs. Brive Oct 10 RC Toulonnais 10.50


Rugby Premiership Predictions for Round 4

Team Ratings for Round 4

The basic method is described on my Department home page.
Here are the team ratings prior to this week’s games, along with the ratings at the start of the season.

Current Rating Rating at Season Start Difference
Wasps 6.39 5.66 0.70
Exeter Chiefs 6.09 7.35 -1.30
Sale Sharks 3.37 4.96 -1.60
Bath 1.31 2.14 -0.80
Harlequins -0.87 -1.08 0.20
Bristol -1.06 1.28 -2.30
Northampton Saints -1.63 -2.48 0.90
Gloucester -1.87 -1.02 -0.80
Newcastle Falcons -2.51 -3.52 1.00
Saracens -3.41 -5.00 1.60
Leicester Tigers -4.40 -6.14 1.70
Worcester Warriors -5.68 -5.71 0.00
London Irish -7.35 -8.05 0.70


Performance So Far

So far there have been 18 matches played, 8 of which were correctly predicted, a success rate of 44.4%.
Here are the predictions for last week’s games.

Game Date Score Prediction Correct
1 Bristol vs. Bath Oct 02 25 – 20 1.60 TRUE
2 Northampton Saints vs. London Irish Oct 02 23 – 21 11.30 TRUE
3 Leicester Tigers vs. Saracens Oct 03 13 – 12 4.00 TRUE
4 Newcastle Falcons vs. Wasps Oct 03 18 – 14 -5.50 FALSE
5 Worcester Warriors vs. Gloucester Oct 03 23 – 31 1.80 FALSE
6 Sale Sharks vs. Exeter Chiefs Oct 04 15 – 25 3.20 FALSE


Predictions for Round 4

Here are the predictions for Round 4. The prediction is my estimated expected points difference with a positive margin being a win to the home team, and a negative margin a win to the away team.

Game Date Winner Prediction
1 Harlequins vs. Bristol Oct 09 Harlequins 4.70
2 Exeter Chiefs vs. Worcester Warriors Oct 10 Exeter Chiefs 16.30
3 Gloucester vs. Sale Sharks Oct 10 Sale Sharks -0.70
4 London Irish vs. Leicester Tigers Oct 10 London Irish 1.50
5 Saracens vs. Newcastle Falcons Oct 10 Saracens 3.60
6 Wasps vs. Northampton Saints Oct 11 Wasps 12.50


Bunnings NPC Predictions for Round 10

Team Ratings for Round 10

The basic method is described on my Department home page.
Here are the team ratings prior to this week’s games, along with the ratings at the start of the season.


Current Rating Rating at Season Start Difference
Tasman 10.69 10.71 -0.00
Auckland 8.62 7.95 0.70
Wellington 5.69 5.62 0.10
Hawke’s Bay 4.48 4.07 0.40
Waikato 4.35 2.52 1.80
Canterbury 4.30 6.44 -2.10
North Harbour 4.04 5.75 -1.70
Bay of Plenty 2.79 5.20 -2.40
Taranaki 1.92 -4.52 6.40
Otago -5.83 -3.47 -2.40
Northland -8.52 -4.75 -3.80
Manawatu -10.22 -14.72 4.50
Southland -11.02 -10.39 -0.60
Counties Manukau -11.10 -10.22 -0.90


Performance So Far

So far there have been 27 matches played, 16 of which were correctly predicted, a success rate of 59.3%.
Here are the predictions for last week’s games.


Game Date Score Prediction Correct
1 Northland vs. Waikato Oct 02 38 – 28 -12.30 FALSE
2 Manawatu vs. Otago Oct 02 27 – 14 -3.10 FALSE
3 Bay of Plenty vs. Wellington Oct 02 33 – 32 0.50 TRUE
4 Tasman vs. Southland Oct 03 51 – 14 23.30 TRUE


Predictions for Round 10

Here are the predictions for Round 10. The prediction is my estimated expected points difference with a positive margin being a win to the home team, and a negative margin a win to the away team.


Game Date Winner Prediction
1 Wellington vs. Canterbury Oct 08 Wellington 4.90
2 Hawke’s Bay vs. Tasman Oct 09 Tasman -2.70
3 Otago vs. Taranaki Oct 09 Taranaki -4.30
4 Southland vs. Manawatu Oct 10 Southland 2.70


October 3, 2021

Every subgroup

Various people have created graphics showing the breakdown of vaccination rates across subpopulations of New Zealand.  They aren’t great (the vaccination rates, not the graphics), but they are improving.  As the graphics show, vaccination rates are lower in some subgroups than others.  Even when we get to 90% coverage on average, we could be well below 90% for some groups of people. This is a problem for two reasons.

The first reason is obvious: equity. People who haven’t been vaccinated yet aren’t just freeloading, they have reasons. For some people it’s harder to get to a vaccination (because of work hours or because they live somewhere remote). Others don’t trust the medical system — often for reasons that were well founded historically. It’s important to make sure everyone has a real opportunity to get vaccinated.

The second reason is less obvious and more statistical: we need a higher vaccination rate if the unvaccinated are not evenly distributed through society.  A cluster of people with lower vaccination rate will not only be at risk of Covid themselves, they will be an opportunity for Covid to spread. This is true of ethnic groups, but also of churches, dog-walkers, soccer moms, fans of provincial rugby, or nerds at statistics conferences.

Modelling the full complexity of NZ society and Covid dynamics is beyond what I have the data and computation resources to do, so I coded up a very simplified model to show, qualitatively, the sorts of things that can happen.  This is a fairly common use of mathematical models: not just to predict what will happen, but to show the range of behaviours that are possible.

The model is a 100×100 grid, where people can only infect their neighbours (no-one accidentally flies to Wānaka or has a job as a truck driver).  Vaccination reduces your risk of being infected, and also reduces your risk of passing on the infection.  With a random 83% of the population vaccinated, the outbreaks can’t spread far (83% of the NZ population is about 95% of the 12+ population). Here are two random outbreaks. Blue is vaccinated, grey is unvaccinated; purple is vaccinated and infected, red is unvaccinated and infected

Now, suppose we have the same 83% vaccination on average, but there’s a high-risk group (lower left) who are less vaccinated and who cluster together. If we’re lucky, a random outbreak misses them; if we’re not, it hits them

Having a non-uniform spread of unvaccinated people increases the number of cases for them, and also for vaccinated people.

We can get more dramatic sorts of clustering, where a group of unvaccinated people are connected to each other and also across society. Again, if we’re lucky, the outbreak hits only vaccinated people; if we’re not lucky, it spread very widely and more vaccinated people are infected than with a uniform spread. Do you feel lucky?

And a more dramatic example, with criss-cross connections of unvaccinated people

These obviously aren’t realistic depictions of New Zealand society, which isn’t square or blue and has lots of long-distance connections. They are, though, depictions of the sort of impact that population structure is able to have on disease spread. These example all have the same overall, high, vaccination rate, but they have very different outbreaks.

It’s not enough to get good vaccine coverage on average. Every subgroup matters.

September 30, 2021

Nature Total Landscaping

Academic journals keep expanding, especially with the growth of open-access journals. Some publishers have reacted to this by creating a bunch of new journals. A few of these publishers give all the journals related names. Nature has Nature Genetics and Nature Communications and Nature Scientific Reports. The BMJ has BMJ Open and BMJ Nutrition, Prevention and Healthcare. The Lancet has The Lancet Public Health and The Lancet Regional Health — Western Pacific and others.

These journals are not the same as the parent journal.  You might or might not think a paper published in Nature was especially reliable because it’s hard to publish in Nature; that’s much less true for Nature Scientific Reports. You might comment that research has been published “in prestigious medical journal The Lancet“, but that’s misleading if it was actually published in The Lancet Regional Health — Western Pacific. I think the importance of journal rankings is vastly overrated, but if you’re going to rely on it you need to get it right.

Back in November, the Trump Campaign held a famous press conference that was not exactly at the Four Seasons hotel.  The label Nature Total Landscaping for these additional journals is a bit unfair — Four Seasons Total Landscaping isn’t even trying to be in the posh hotel business — but it was irresistible to science social media.

September 28, 2021

United Rugby Championship Predictions for Week 2

Team Ratings for Week 2

The basic method is described on my Department home page.
Here are the team ratings prior to this week’s games, along with the ratings at the start of the season.

Current Rating Rating at Season Start Difference
Leinster 15.38 14.79 0.60
Munster 11.38 10.69 0.70
Ulster 7.03 7.41 -0.40
Glasgow 4.07 3.69 0.40
Bulls 3.06 3.65 -0.60
Edinburgh 2.34 2.90 -0.60
Connacht 1.06 1.72 -0.70
Ospreys 1.04 0.94 0.10
Cardiff Rugby 0.55 -0.11 0.70
Stormers -0.18 0.00 -0.20
Scarlets -0.21 -0.77 0.60
Sharks -0.77 -0.07 -0.70
Lions -3.11 -3.91 0.80
Benetton -4.32 -4.50 0.20
Dragons -7.02 -6.92 -0.10
Zebre -14.27 -13.47 -0.80


Performance So Far

So far there have been 8 matches played, 8 of which were correctly predicted, a success rate of 100%.
Here are the predictions for last week’s games.

Game Date Score Prediction Correct
1 Zebre vs. Lions Sep 25 26 – 38 -3.10 TRUE
2 Cardiff Rugby vs. Connacht Sep 25 33 – 21 4.70 TRUE
3 Ulster vs. Glasgow Sep 25 35 – 29 10.20 TRUE
4 Benetton vs. Stormers Sep 25 22 – 18 2.00 TRUE
5 Edinburgh vs. Scarlets Sep 26 26 – 22 10.20 TRUE
6 Leinster vs. Bulls Sep 26 31 – 3 17.60 TRUE
7 Munster vs. Sharks Sep 26 42 – 17 17.30 TRUE
8 Dragons vs. Ospreys Sep 26 23 – 27 -2.90 TRUE


Predictions for Week 2

Here are the predictions for Week 2. The prediction is my estimated expected points difference with a positive margin being a win to the home team, and a negative margin a win to the away team.

Game Date Winner Prediction
1 Connacht vs. Bulls Oct 02 Connacht 4.50
2 Scarlets vs. Lions Oct 02 Scarlets 9.40
3 Benetton vs. Edinburgh Oct 02 Edinburgh -0.20
4 Dragons vs. Leinster Oct 02 Leinster -15.90
5 Glasgow vs. Sharks Oct 03 Glasgow 11.30
6 Zebre vs. Ulster Oct 03 Ulster -14.80
7 Munster vs. Stormers Oct 03 Munster 18.10
8 Ospreys vs. Cardiff Rugby Oct 03 Ospreys 5.50


Top 14 Predictions for Round 5

Team Ratings for Round 5

The basic method is described on my Department home page.
Here are the team ratings prior to this week’s games, along with the ratings at the start of the season.

Current Rating Rating at Season Start Difference
Stade Toulousain 7.97 6.83 1.10
La Rochelle 7.11 6.78 0.30
Racing-Metro 92 6.37 6.13 0.20
Bordeaux-Begles 5.81 5.42 0.40
Lyon Rugby 5.25 4.15 1.10
Clermont Auvergne 4.14 5.09 -1.00
RC Toulonnais 1.50 1.82 -0.30
Montpellier 0.88 -0.01 0.90
Castres Olympique 0.43 0.94 -0.50
Stade Francais Paris -0.05 1.20 -1.30
Section Paloise -2.31 -2.25 -0.10
Brive -2.92 -3.19 0.30
Biarritz -3.09 -2.78 -0.30
USA Perpignan -3.72 -2.78 -0.90


Performance So Far

So far there have been 28 matches played, 21 of which were correctly predicted, a success rate of 75%.
Here are the predictions for last week’s games.

Game Date Score Prediction Correct
1 Bordeaux-Begles vs. Brive Sep 25 29 – 10 14.80 TRUE
2 La Rochelle vs. Biarritz Sep 25 59 – 17 15.10 TRUE
3 Section Paloise vs. Montpellier Sep 25 23 – 22 3.60 TRUE
4 Stade Francais Paris vs. Castres Olympique Sep 25 34 – 10 4.80 TRUE
5 Racing-Metro 92 vs. Lyon Rugby Sep 26 24 – 20 8.00 TRUE
6 USA Perpignan vs. RC Toulonnais Sep 26 12 – 9 1.10 TRUE
7 Stade Toulousain vs. Clermont Auvergne Sep 27 27 – 15 10.10 TRUE


Predictions for Round 5

Here are the predictions for Round 5. The prediction is my estimated expected points difference with a positive margin being a win to the home team, and a negative margin a win to the away team.

Game Date Winner Prediction
1 Brive vs. Stade Francais Paris Oct 02 Brive 3.60
2 Lyon Rugby vs. Bordeaux-Begles Oct 02 Lyon Rugby 5.90
3 Montpellier vs. La Rochelle Oct 02 Montpellier 0.30
4 USA Perpignan vs. Section Paloise Oct 02 USA Perpignan 5.10
5 Biarritz vs. Stade Toulousain Oct 03 Stade Toulousain -4.60
6 Castres Olympique vs. RC Toulonnais Oct 03 Castres Olympique 5.40
7 Clermont Auvergne vs. Racing-Metro 92 Oct 04 Clermont Auvergne 4.30


Rugby Premiership Predictions for Round 3

Team Ratings for Round 3

The basic method is described on my Department home page.
Here are the team ratings prior to this week’s games, along with the ratings at the start of the season.

Current Rating Rating at Season Start Difference
Wasps 6.93 5.66 1.30
Exeter Chiefs 5.38 7.35 -2.00
Sale Sharks 4.09 4.96 -0.90
Bath 1.59 2.14 -0.50
Harlequins -0.87 -1.08 0.20
Northampton Saints -1.09 -2.48 1.40
Bristol -1.33 1.28 -2.60
Gloucester -2.43 -1.02 -1.40
Newcastle Falcons -3.05 -3.52 0.50
Saracens -3.65 -5.00 1.40
Leicester Tigers -4.16 -6.14 2.00
Worcester Warriors -5.13 -5.71 0.60
London Irish -7.88 -8.05 0.20


Performance So Far

So far there have been 12 matches played, 5 of which were correctly predicted, a success rate of 41.7%.
Here are the predictions for last week’s games.

Game Date Score Prediction Correct
1 Gloucester vs. Leicester Tigers Sep 25 26 – 33 7.80 FALSE
2 Bath vs. Newcastle Falcons Sep 26 13 – 20 11.00 FALSE
3 Exeter Chiefs vs. Northampton Saints Sep 26 24 – 26 12.50 FALSE
4 Harlequins vs. Worcester Warriors Sep 26 35 – 29 9.30 TRUE
5 Wasps vs. Bristol Sep 26 44 – 8 10.20 TRUE
6 London Irish vs. Sale Sharks Sep 27 31 – 31 -8.50 FALSE


Predictions for Round 3

Here are the predictions for Round 3. The prediction is my estimated expected points difference with a positive margin being a win to the home team, and a negative margin a win to the away team.

Game Date Winner Prediction
1 Bristol vs. Bath Oct 02 Bristol 1.60
2 Northampton Saints vs. London Irish Oct 02 Northampton Saints 11.30
3 Leicester Tigers vs. Saracens Oct 03 Leicester Tigers 4.00
4 Newcastle Falcons vs. Wasps Oct 03 Wasps -5.50
5 Worcester Warriors vs. Gloucester Oct 03 Worcester Warriors 1.80
6 Sale Sharks vs. Exeter Chiefs Oct 04 Sale Sharks 3.20