December 20, 2021

Fungible carbon

There’s a piece in Stuff about a startup using NFTs to do carbon capture.  I’m not going to get into a general discussion of NFTs here1.  What’s StatsChat-relevant about the story is the general principle that when you have two numbers you should do something with them.

The company in question has a current product and a planned product.  The current product is a subscription that offsets more carbon than you use on Instagram, for $5/month.  The planned product is a set of $1000 NFTs that will offset 1 tonne more carbon than they cost to produce, and will potentially generate royalties on future resales to offset more emissions.

Looking at the Instagram offset subscription, you’re getting about 6kg of offset per dollar, so about $160/ tonne.  The NZ emissions trading scheme price is about $70/tonne. You might be worried about the quality and reliability of the NZ offsets — I haven’t looked into this in any detail, and you probably haven’t either — so you might be willing to pay more for offsets you trusted more and which had the potential to develop new technologies.   Or you could buy for US$15/tonne directly from Tradewater, one of the companies used by Cool Points Club, whose approach is to prevent emissions of used refrigerant gasses by incinerating them. The monthly price does include GST and the cost of running the system; I don’t think it’s great value, but it’s priced transparently and it’s probably capturing money that wouldn’t otherwise be spent on carbon offsets.

The NFTs initially cost about $1000 for one tonne of offset. That’s very expensive.  You can buy 14 tonnes of generic NZ offset for that much, or 66 tonnes directly from Tradewater (give or take any GST liability).  If these are going to be worthwhile, nearly all of the value will have to be in the NFT, not in the offset.

1 and since I moderate the comments, neither are you
December 19, 2021

Briefly

  • Pfizer’s vaccine trial in kids 2-5 years old wasn’t successful: the dose (1/10th adult dose, 30% of 5-12yr dose) seems to be too low. They will try a three-dose series.  It did work in 6-24 months kidlets.  Pfizer is also testing third-dose boosters for all child age ranges
  • “Why trust and transparency are vital in a pandemic” from the UK Office of Statistics Regulation. They note “It will not always be possible to publish information before it is used publicly. In these cases, it is important that data are published in an accessible form as soon as possible after they have been used, with the context provided and strengths and limitations made clear.
  • Lee Wilkinson, a pioneer in statistical computing and graphics, passed away on December 10.  Among other influential contributions, he developed the statistical package ‘Systat’ and wrote ‘The Grammar of Graphics’
  • Florida is a counterexample to correlations between Covid vaccination and politics in the US. That seems to be partly because their data are wrong. “People age 18 and over in the 33122 area code had more than a 2,700% vaccination rate, according to the data….’That’s the airport,’ Gelber said.”
  • Via Jenny Nicholls on Twitter, a Washington Post story on injuries from bouncy castles. The story quotes the number of injuries as 82,203 from 2008 to 2013 and as one every 46 minutes in 2013.  You might think about whether these are compatible and which sounds bigger.  It also works out as about 0.2% of the roughly 8 million unintentional injuries in kids leading to emergency department visits. Which I think is more than I’d expect

Mild or bitter

There’s still discussion about whether the Omicron covid variant is milder than Delta. We don’t really know yet, but this post is about why that’s not even the question.

First, Omicron is still scary: people do end up in hospital; people do die; even a ‘mild’ case can still really suck; and we have literally no idea what proportion of people will get Long Covid. If it’s milder, it’s still very much in the Do Not Want category.

Second, we do know that the proportion of people who get hospitalised will probably be lower than with Delta, and that isn’t the answer to ‘mild or not?’ The primary facts about Omicron are that (a) the vaccine is definitely much less effective at preventing infection, but (b) the vaccine is probably still somewhat effective at preventing severe disease.   Suppose, to give us something to work with, an Omicron infection was exactly as likely to cause hospitalisation for an infection in vaccinated individual as Delta, and was exactly as likely to cause hospitalisation for an infection in an unvaccinated individual as Delta.

If you (Dear Reader) are vaccinated or otherwise immune, you’re more likely to be hospitalised by Omicron because you’re more likely to be infected. The vaccine protection is less, even with a third dose, and the prevalence will be higher so you’re more likely to be exposed. If you aren’t vaccinated, you’re more likely to be hospitalised by Omicron because you’re more likely to be infected: the communal vaccine protection is  less so the prevalence will be higher and you’re more likely to be exposed.  So, in that sense Omicron is worse: you are more likely to get sick, more likely to be hospitalised, probably more likely to die than if Omicron hadn’t come along.

On the other hand, the fraction of cases who end up in hospital is likely to be lower than we were seeing with Delta.  That’s because we will have a larger fraction of cases in vaccinated people, and these are less likely to end up in hospital.  The number in hospital will go up, but by a smaller multiple than the total number of infections.

So, if the question about a milder variant is “will the fraction of people with serious disease go down?” the answer is probably “yes”. If the question is “will the number of people with serious disease go down?” the answer is probably “no”.  If the question is “should I relax because it’s not serious?”, the answer is “holy fuck no”.

December 10, 2021

Briefly

  • From Ars Technica, Report reveals which sealed NES games are the rarest of the rare. This is relevant because most of the story is about selection bias “Wata’s sealed-NES report, for instance, only shows one graded, sealed copy of Jeopardy!, a game that most collector’s regard as pretty common.
    This disparity could be because sealed copies of Jeopardy! happen to be much rarer than open boxes or loose carts. Or it could simply be that almost no one has bothered going through the time, expense, and hassle of going to Wata for a professional grade on a relatively ignorable game like Jeopardy!.
  • Phillip Bump, of the Washington Post, is starting a newsletterHow to read this chart
  • NZ police release an independent report on facial recognition technology
  • The police, and various other agencies, have asked the Ministry of Health for data from Covid contact tracing. They were (correctly) turned down.
  • According to UK supermarket chain Tesco, via Wales Online,  33% of people in London and 39% of 18-24 year olds in the UK celebrate Thanksgiving. I’m reasonably sure this isn’t true, but it doesn’t seem possible to find out any more about where they got the numbers.
  • NZ Herald, Nov 22 “Auckland CBD sinking into anarchy and resembling 1980s New York, city leaders told. Newsroom, Dec 6, “yeah nah”

Making it up in volume

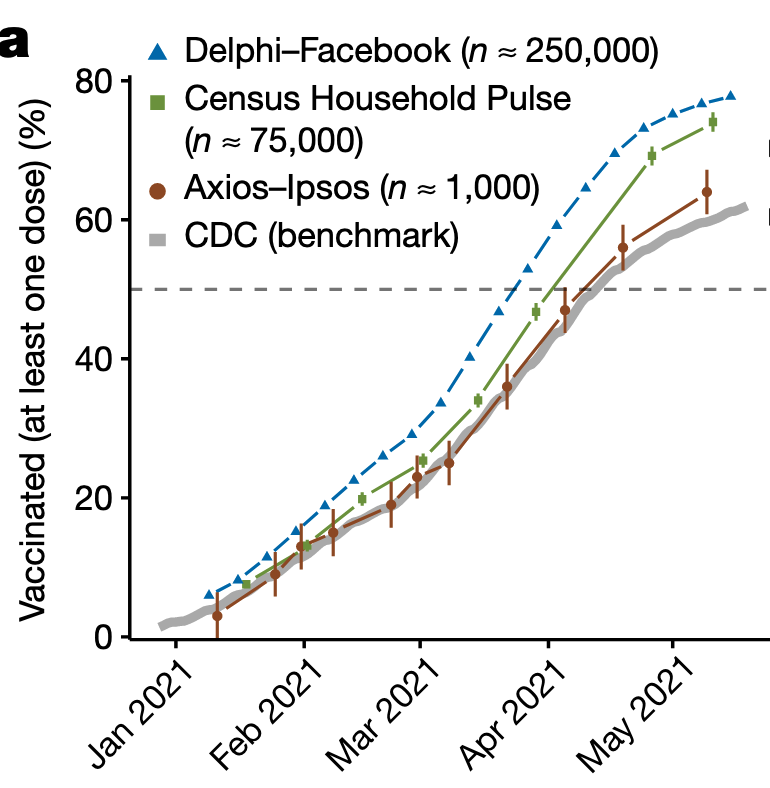
This isn’t precisely statistics in the media, but it’s research about the sort of stories we discuss a lot.  A new research paper in Nature looks at three estimates over time of the proportion of people vaccinated in the US. Two of these were based on large self-selected sets of respondents, the third was much smaller but had an attempt at random sampling.

What’s interesting about this is that we know the truth, pretty well.  US States kept track of vaccinations and the CDC collated the data.  There aren’t many examples where we have that sort of ground truth — the closest we come is elections, and even then we only get the truth for one point in time.

Here’s a graph from the research paper:

The two ‘big data’ estimates were much more precise than the smaller survey, but also much more biased: they were confidently wrong, where the small survey was pretty much right.  For some reason (and it’s not hard to think of possibilities) people who were vaccinated were more likely to respond in the big unselected data sets.

This is a general ‘big data’ phenomenon: when you get more data it tends to be of lower quality.  It’s very hard to overcome the data quality problem, so you will often get worse answers, but your estimation procedure will tell you they are much better. The ‘margin of error’ on the 75,000-person Census Household Pulse is much smaller than on the Axios-Ipsos survey, but the actual error is much larger. If you’ve seen lots of 1000-person surveys reported in the media and wondered why they aren’t bigger, this is the reason.  It’s not that you can’t do a 10,000-person survey; it’s that it needs to have much higher data quality than a 1000-person survey to be worth doing.

Now, ‘big data’ isn’t useless. It can be possible, with detailed enough data on a large number of people, to get around the data quality problems.  The polling company YouGov has had some success with large unselected samples and reweighting them to match the population. But that’s only possible where you have good data for the sample and the  population — the Nature paper hypothesises that collecting political affiliation and rurality might have helped, but the ‘big data’ surveys didn’t.

I didn’t have anything to do with this research, but one of my research areas is combining big databases and small samples in medical research: in the small sample you can afford to get accurate data and then you can use the big database to get extra precision.

December 8, 2021

Viagra and Alzheimers

Q: Did you see that Viagra prevents Alzheimer’s?

A: That’s not quite what it says

Q: “Viagra could be used to treat Alzheimer’s disease, study finds”

A: It’s possible that it could be, if it turns out to work

Q: That’s a bit misleading

A: Well, it’s a headline, what do you expect?

Q: Do you want to say that the Guardian covered this better than NewstalkZB?

A: No. Well, whether or not I want to, it’s not true.  The Guardian had the misleading headline and NewstalkZB has an expert saying “As exciting as it may be, it does sound a bit too good to be true though.”

Q: So it’s just mice?

A: No, I don’t think anyone would have had any reason to test this in mice before

Q: Men?

A: Yes. Well, mostly men. Health insurance data on 7.2 million people and 1600 different drugs

Q: How effective is Viagra, then?

A: We don’t know

Q: You know what I mean

A: The people who were prescribed Viagra were 70% less likely to end up with Alzheimer’s

Q: That’s a huge effect!

A: A huge difference. To quote Dr Phil Wood on NewstalkZB “As exciting as it may be, it does sound a bit too good to be true though.”

Q: Whatever. Can you really get a correlation that strong when it’s not a real effect?

A: Finnish research found 2/3 lower rate of dementia in people who regularly used saunas. And in a Swedish study, married men had about half the risk of single or widowed men. And early reports looking at correlations between statin drugs and Alzheimer’s found rates lower by up to 70%. And…

Q: Ok, I get the message. But it could be real?

A: In principle. The researchers give some biological arguments for why it might.  Though given how hard Alzheimer’s is to treat, it would be really surprising if some drug accidentally did way better than anything we’ve ever developed

Q: Maybe there should be a clinical trial?

A: Perhaps. Or at least an observational study in a different population. While it probably won’t work, we wouldn’t want to miss out if it did

December 7, 2021

United Rugby Championship Predictions for Week 8

Team Ratings for Week 8

The basic method is described on my Department home page.
Here are the team ratings prior to this week’s games, along with the ratings at the start of the season.

Current Rating Rating at Season Start Difference
Leinster 15.38 14.79 0.60
Munster 10.95 10.69 0.30
Ulster 7.17 7.41 -0.20
Connacht 3.16 1.72 1.40
Edinburgh 3.04 2.90 0.10
Glasgow 2.98 3.69 -0.70
Bulls 1.98 3.65 -1.70
Sharks 0.97 -0.07 1.00
Ospreys 0.69 0.94 -0.20
Stormers 0.29 0.00 0.30
Cardiff Rugby -0.89 -0.11 -0.80
Scarlets -1.76 -0.77 -1.00
Lions -1.80 -3.91 2.10
Benetton -4.32 -4.50 0.20
Dragons -6.12 -6.92 0.80
Zebre -15.68 -13.47 -2.20


Performance So Far

So far there have been 48 matches played, 35 of which were correctly predicted, a success rate of 72.9%.
Here are the predictions for last week’s games.

Game Date Score Prediction Correct
1 Edinburgh vs. Benetton Dec 04 24 – 10 13.80 TRUE
2 Leinster vs. Connacht Dec 04 47 – 19 15.90 TRUE
3 Sharks vs. Bulls Dec 04 30 – 16 2.70 TRUE
4 Ospreys vs. Ulster Dec 05 19 – 13 -1.30 FALSE
5 Glasgow vs. Dragons Dec 05 33 – 14 14.90 TRUE
6 Stormers vs. Lions Dec 05 19 – 37 9.70 FALSE


Predictions for Week 8

Here are the predictions for Week 8. The prediction is my estimated expected points difference with a positive margin being a win to the home team, and a negative margin a win to the away team.

Game Date Winner Prediction
1 Zebre vs. Benetton Dec 25 Benetton -6.40
2 Cardiff Rugby vs. Scarlets Dec 27 Cardiff Rugby 5.90
3 Ospreys vs. Dragons Dec 27 Ospreys 11.80
4 Ulster vs. Connacht Dec 27 Ulster 9.00
5 Munster vs. Leinster Dec 27 Munster 0.60
6 Glasgow vs. Edinburgh Dec 28 Glasgow 4.90


Top 14 Predictions for Round 13

Team Ratings for Round 13

The basic method is described on my Department home page.
Here are the team ratings prior to this week’s games, along with the ratings at the start of the season.

Current Rating Rating at Season Start Difference
Stade Toulousain 8.35 6.83 1.50
La Rochelle 7.67 6.78 0.90
Bordeaux-Begles 7.40 5.42 2.00
Lyon Rugby 5.47 4.15 1.30
Clermont Auvergne 4.85 5.09 -0.20
Racing-Metro 92 4.01 6.13 -2.10
Montpellier 3.07 -0.01 3.10
Castres Olympique 0.82 0.94 -0.10
Stade Francais Paris 0.13 1.20 -1.10
RC Toulonnais -0.19 1.82 -2.00
Section Paloise -2.78 -2.25 -0.50
Brive -2.96 -3.19 0.20
Biarritz -4.14 -2.78 -1.40
USA Perpignan -4.35 -2.78 -1.60


Performance So Far

So far there have been 84 matches played, 64 of which were correctly predicted, a success rate of 76.2%.
Here are the predictions for last week’s games.

Game Date Score Prediction Correct
1 Bordeaux-Begles vs. Stade Toulousain Dec 05 17 – 7 5.10 TRUE
2 Castres Olympique vs. Racing-Metro 92 Dec 05 25 – 3 2.00 TRUE
3 Clermont Auvergne vs. Biarritz Dec 05 39 – 11 14.60 TRUE
4 Lyon Rugby vs. Brive Dec 05 41 – 0 13.20 TRUE
5 Montpellier vs. USA Perpignan Dec 05 30 – 6 13.20 TRUE
6 Section Paloise vs. RC Toulonnais Dec 05 16 – 16 4.40 FALSE
7 Stade Francais Paris vs. La Rochelle Dec 06 25 – 20 -1.70 FALSE


Predictions for Round 13

Here are the predictions for Round 13. The prediction is my estimated expected points difference with a positive margin being a win to the home team, and a negative margin a win to the away team.

Game Date Winner Prediction
1 Biarritz vs. Montpellier Dec 27 Montpellier -0.70
2 Brive vs. Clermont Auvergne Dec 27 Clermont Auvergne -1.30
3 La Rochelle vs. Lyon Rugby Dec 27 La Rochelle 8.70
4 Racing-Metro 92 vs. Section Paloise Dec 27 Racing-Metro 92 13.30
5 Stade Toulousain vs. Stade Francais Paris Dec 27 Stade Toulousain 14.70
6 RC Toulonnais vs. Bordeaux-Begles Dec 27 Bordeaux-Begles -1.10
7 USA Perpignan vs. Castres Olympique Dec 27 USA Perpignan 1.30


Rugby Premiership Predictions for Round 11

Team Ratings for Round 11

The basic method is described on my Department home page.
Here are the team ratings prior to this week’s games, along with the ratings at the start of the season.

Current Rating Rating at Season Start Difference
Exeter Chiefs 5.23 7.35 -2.10
Saracens 2.39 -5.00 7.40
Wasps 2.08 5.66 -3.60
Sale Sharks 1.98 4.96 -3.00
Harlequins 0.66 -1.08 1.70
Leicester Tigers 0.59 -6.14 6.70
Northampton Saints 0.02 -2.48 2.50
Gloucester -0.31 -1.02 0.70
Bristol -2.94 1.28 -4.20
Bath -3.94 2.14 -6.10
Newcastle Falcons -4.01 -3.52 -0.50
London Irish -4.27 -8.05 3.80
Worcester Warriors -9.09 -5.71 -3.40


Performance So Far

So far there have been 60 matches played, 29 of which were correctly predicted, a success rate of 48.3%.
Here are the predictions for last week’s games.

Game Date Score Prediction Correct
1 Exeter Chiefs vs. Saracens Dec 05 18 – 15 8.00 TRUE
2 Gloucester vs. Bristol Dec 05 27 – 10 5.90 TRUE
3 Leicester Tigers vs. Harlequins Dec 05 16 – 14 4.90 TRUE
4 London Irish vs. Newcastle Falcons Dec 05 43 – 21 2.20 TRUE
5 Northampton Saints vs. Bath Dec 05 40 – 19 6.90 TRUE
6 Worcester Warriors vs. Wasps Dec 05 32 – 31 -7.70 FALSE


Predictions for Round 11

Here are the predictions for Round 11. The prediction is my estimated expected points difference with a positive margin being a win to the home team, and a negative margin a win to the away team.

Game Date Winner Prediction
1 Bath vs. Gloucester Dec 27 Bath 0.90
2 Bristol vs. Leicester Tigers Dec 27 Bristol 1.00
3 Harlequins vs. Northampton Saints Dec 27 Harlequins 5.10
4 Newcastle Falcons vs. Sale Sharks Dec 27 Sale Sharks -1.50
5 Saracens vs. Worcester Warriors Dec 27 Saracens 16.00
6 Wasps vs. London Irish Dec 27 Wasps 10.80


December 2, 2021

Internet use up

The Herald has numbers from Chorus on internet data use, which is up since last October. Their data is broken down by region. I noticed that Auckland was at the top and wondered how much of this was better internet access in Auckland and how much was just larger households. Here’s a graph (click to embiggen). I had to guess that the ‘Hamilton’ region meant Waikato, and the table is missing Marlborough. Also, my data source for household  size had separate figures for Nelson and Tasman, but it should be basically right.

That’s actually more of an impact of household size than I expected. Also, I was a bit surprised that the West Coast is above the fitted line, saying that it has more internet use than you’d expect from household size, but I suppose that’s what you’d hope when people are spread out a lot.

The regression line is a bit unreliable with such a small dataset, and leaving out Auckland weakens the evidence for a relationship quite a bit (though it doesn’t actually change the fitted line very much). It’s worth thinking about alternative explanations. It’s reasonable that internet use would scale with household size (and I did think of this before looking at the data), but it could also be that Auckland has larger household size and more internet use because it’s a city