From 1News on Twitter — with the text “Do these stats make you mad? Pay attention – for every $100 a man earns in NZ, a woman doing the same job earns $8 less.”
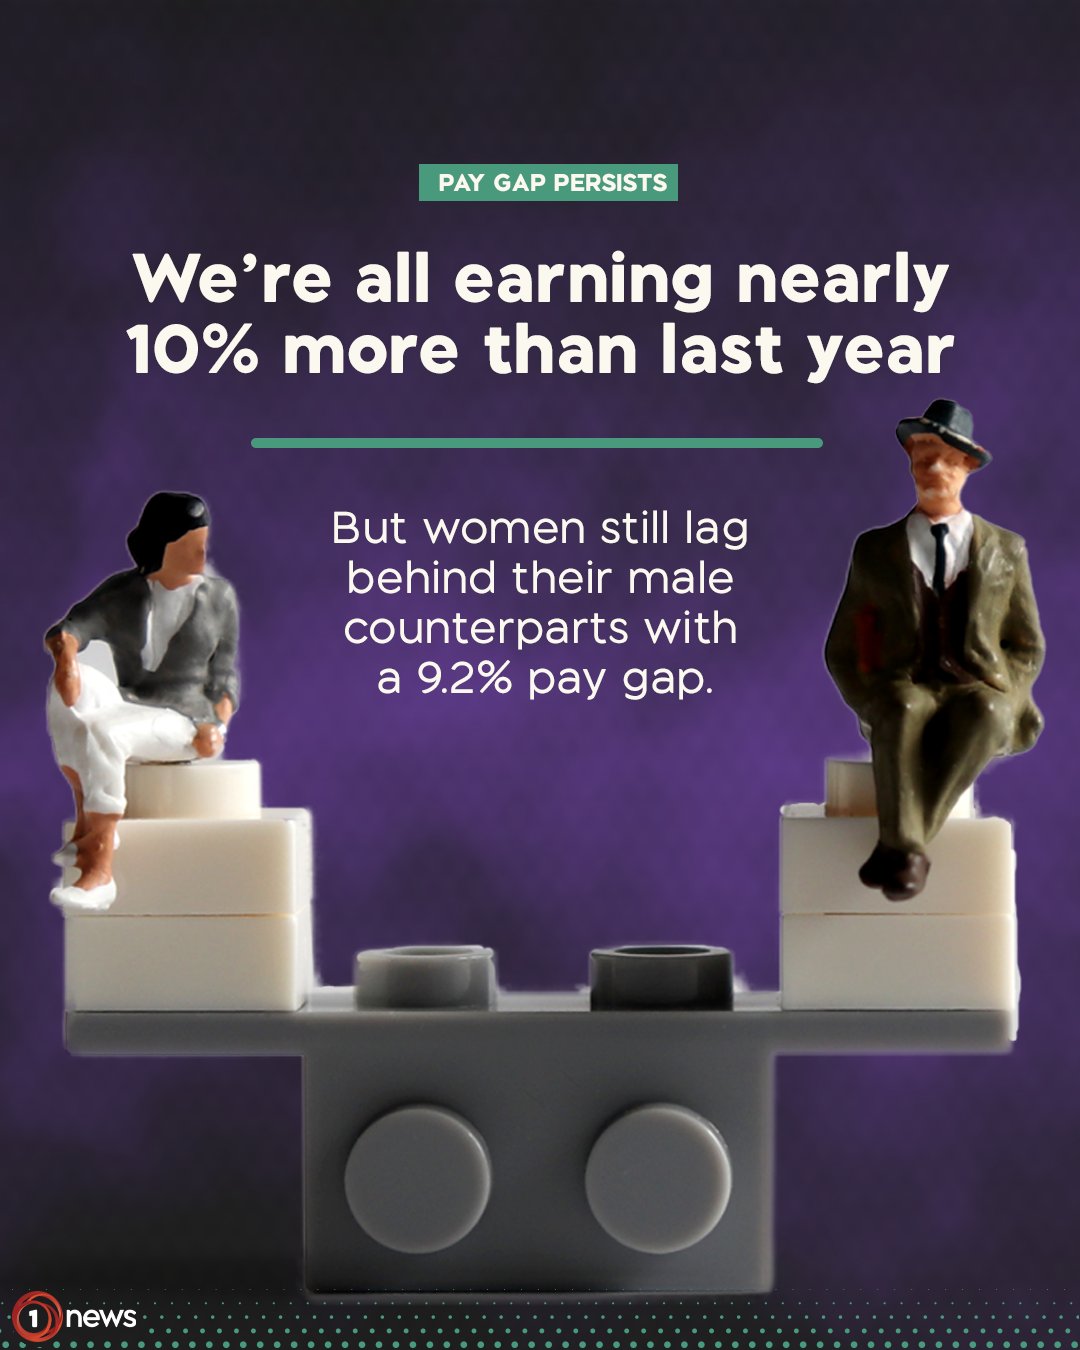
As Graeme Edgeler says, the linked article does not substantiate the claim in the text of the tweet at all. The $8 number isn’t referenced in the article and the 9.2% number doesn’t measure earnings differences for two people doing the same job. It’s also worth considering a second article about the new income statistics linked from the first article. It gives yet another pair of income numbers for men and women, one where the gap is 25% and is slightly smaller than last year. On top of that, the 10% and 9.2% claims in the image seem to be about two different income measures, though it’s not really clear where the 10% is sourced. I’ll also link the new StatsNZ figures, which 1News doesn’t bother to do.
Let’s start with the gender pay gap. Stats New Zealand’s indicator for gender pay differences is the percentage difference in median hourly earnings. They have a nice document from 2015 explaining why they define it this way. It’s not a perfect summary — it’s not going to be; it’s a single number — but it’s what they use. A gender pay gap of 9.2% means that if median hourly earnings for men were $100 (sadly, no) they would be $90.80 for women. That’s not $8 less; it’s $9.20 less. The $8 figure doesn’t seem to come from anything in the article, and it’s an understatement of the gap, which is a bit unusual.
Not only is the figure of $8 apparently wrong, the interpretation is wrong. The gender pay gap isn’t about comparing income for the same job. That’s good, because a significant part of gender discrimination in pay comes from women’s jobs being paid less. Looking at the exact same job would understate the pay gap, and would get you into endless arguments over, eg, whether “captain of the national rugby union team” was or was not the same job for Sam Cane and Ruahei Demant. The interpretation is also wrong because another reason women earn less money than men is they tend to work fewer hours, and that’s not included in the pay gap.
The second linked article discusses median weekly earnings. It has figures of $1320 for men and $1055 for women, a 25% gap. The increase in median weekly earnings for the population as a whole was 8.8%, which is the only whole-population percentage increase in either article, so it seems like it should be the basis for “we’re all earning nearly 10% more than last year”. If you dismiss the ‘all’ as journalistic license, and rephrase as “a typical person” then I suppose 8.8% is nearly 10%, but it’s further from 10% than 9.2% is.
Given how different the gender pay gap is when you compute it in different ways, you might wonder if international comparisons use StatsNZ’s preferred definition. They don’t. The OECD restricts to people working full time: hourly and weekly earnings will have the same gaps, but you’ll miss out the pay gap due to more women working in part time jobs. By the OECD definition, the New Zealand gender pay gap is 6.7% for employees and 30.8% for self-employed people.
The article linked to the tweet is about a campaign to make large businesses disclose their gender pay gap. I’m fairly generally in favour of this sort of transparency, but when major news outlets seem to not understand or not care what the number means, publicising it might not be as effective as you’d like.
Recent comments