January 3, 2023

United Rugby Championship Predictions for Week 12


Team Ratings for Week 12

The basic method is described on my Department home page.
Here are the team ratings prior to this week’s games, along with the ratings at the start of the season.

Current Rating Rating at Season Start Difference
Leinster 17.66 16.79 0.90
Ulster 9.06 9.27 -0.20
Munster 8.74 9.78 -1.00
Stormers 8.09 7.14 1.00
Bulls 7.22 7.84 -0.60
Sharks 6.21 6.95 -0.70
Edinburgh 2.82 3.58 -0.80
Glasgow 1.65 -0.00 1.70
Connacht 0.76 -1.60 2.40
Ospreys -1.58 -0.83 -0.80
Lions -2.44 -1.74 -0.70
Benetton -3.90 -3.68 -0.20
Scarlets -4.88 -1.23 -3.60
Cardiff Rugby -5.28 -7.42 2.10
Dragons -9.94 -11.81 1.90
Zebre -18.15 -16.99 -1.20


Performance So Far

So far there have been 85 matches played, 65 of which were correctly predicted, a success rate of 76.5%.
Here are the predictions for last week’s games.

Game Date Score Prediction Correct
1 Edinburgh vs. Glasgow Dec 31 25 – 32 6.40 FALSE
2 Zebre vs. Benetton Dec 31 17 – 40 -9.00 TRUE
3 Sharks vs. Bulls Jan 01 47 – 20 1.00 TRUE
4 Stormers vs. Lions Jan 01 40 – 8 12.90 TRUE
5 Cardiff Rugby vs. Ospreys Jan 02 19 – 22 1.10 FALSE
6 Scarlets vs. Dragons Jan 02 33 – 17 8.20 TRUE
7 Ulster vs. Munster Jan 02 14 – 15 5.70 FALSE
8 Leinster vs. Connacht Jan 02 41 – 12 20.00 TRUE


Predictions for Week 12

Here are the predictions for Week 12. The prediction is my estimated expected points difference with a positive margin being a win to the home team, and a negative margin a win to the away team.

Game Date Winner Prediction
1 Dragons vs. Bulls Jan 07 Bulls -12.70
2 Munster vs. Lions Jan 07 Munster 15.70
3 Benetton vs. Ulster Jan 08 Ulster -8.50
4 Edinburgh vs. Zebre Jan 08 Edinburgh 25.50
5 Cardiff Rugby vs. Scarlets Jan 08 Cardiff Rugby 3.60
6 Connacht vs. Sharks Jan 08 Sharks -0.90
7 Ospreys vs. Leinster Jan 08 Leinster -14.70
8 Glasgow vs. Stormers Jan 09 Stormers -1.90


Top 14 Predictions for Round 15

Team Ratings for Round 15

The basic method is described on my Department home page.
Here are the team ratings prior to this week’s games, along with the ratings at the start of the season.

Current Rating Rating at Season Start Difference
Stade Toulousain 8.29 6.34 1.90
La Rochelle 6.45 6.88 -0.40
Racing 92 4.82 4.86 -0.00
Bordeaux Begles 4.76 5.27 -0.50
Montpellier 4.28 4.18 0.10
Stade Francais 4.27 -1.05 5.30
Toulon 3.90 4.09 -0.20
Clermont 1.70 4.05 -2.40
Castres Olympique 1.67 2.87 -1.20
Lyon 1.05 3.10 -2.10
Aviron Bayonnais -1.49 -4.26 2.80
Section Paloise -1.51 -2.12 0.60
USA Perpignan -5.43 -2.75 -2.70
Brive -5.51 -4.20 -1.30


Performance So Far

So far there have been 98 matches played, 69 of which were correctly predicted, a success rate of 70.4%.
Here are the predictions for last week’s games.

Game Date Score Prediction Correct
1 Bordeaux Begles vs. Montpellier Dec 31 40 – 10 5.50 TRUE
2 Aviron Bayonnais vs. Toulon Jan 01 23 – 18 0.70 TRUE
3 Castres Olympique vs. Racing 92 Jan 01 26 – 26 3.70 FALSE
4 Lyon vs. Brive Jan 01 27 – 30 14.20 FALSE
5 Stade Francais vs. Section Paloise Jan 01 37 – 3 10.80 TRUE
6 USA Perpignan vs. La Rochelle Jan 01 10 – 29 -4.40 TRUE
7 Clermont vs. Stade Toulousain Jan 02 13 – 32 1.20 FALSE


Predictions for Round 15

Here are the predictions for Round 15. The prediction is my estimated expected points difference with a positive margin being a win to the home team, and a negative margin a win to the away team.

Game Date Winner Prediction
1 Bordeaux Begles vs. Aviron Bayonnais Jan 08 Bordeaux Begles 12.80
2 Brive vs. Toulon Jan 08 Toulon -2.90
3 Clermont vs. USA Perpignan Jan 08 Clermont 13.60
4 La Rochelle vs. Stade Toulousain Jan 08 La Rochelle 4.70
5 Section Paloise vs. Lyon Jan 08 Section Paloise 3.90
6 Stade Francais vs. Castres Olympique Jan 08 Stade Francais 9.10
7 Montpellier vs. Racing 92 Jan 09 Montpellier 6.00


Rugby Premiership Predictions for Round 15

Team Ratings for Round 15

The basic method is described on my Department home page.
Here are the team ratings prior to this week’s games, along with the ratings at the start of the season.

Current Rating Rating at Season Start Difference
Sale Sharks 5.19 4.14 1.10
Leicester Tigers 3.83 7.93 -4.10
Gloucester 2.67 5.92 -3.20
Northampton Saints 2.61 3.99 -1.40
Saracens 2.15 -5.00 7.20
Harlequins 1.81 3.92 -2.10
Exeter Chiefs 0.84 3.67 -2.80
London Irish 0.54 -1.65 2.20
Wasps -0.18 0.77 -1.00
Bristol -3.19 -2.43 -0.80
Bath -5.68 -9.15 3.50
Newcastle Falcons -7.82 -8.76 0.90
Worcester Warriors -11.69 -12.27 0.60


Performance So Far

So far there have been 67 matches played, 45 of which were correctly predicted, a success rate of 67.2%.
Here are the predictions for last week’s games.

Game Date Score Prediction Correct
1 Sale Sharks vs. Leicester Tigers Dec 31 40 – 5 2.80 TRUE
2 Bath vs. Newcastle Falcons Jan 01 24 – 16 6.40 TRUE
3 Gloucester vs. London Irish Jan 01 8 – 6 7.30 TRUE
4 Saracens vs. Exeter Chiefs Jan 01 35 – 3 3.00 TRUE
5 Northampton Saints vs. Harlequins Jan 02 46 – 17 2.70 TRUE


Predictions for Round 15

Here are the predictions for Round 15. The prediction is my estimated expected points difference with a positive margin being a win to the home team, and a negative margin a win to the away team.

Game Date Winner Prediction
1 Gloucester vs. Saracens Jan 07 Gloucester 5.00
2 Newcastle Falcons vs. Leicester Tigers Jan 08 Leicester Tigers -7.10
3 Exeter Chiefs vs. Northampton Saints Jan 08 Exeter Chiefs 2.70
4 Harlequins vs. Sale Sharks Jan 09 Harlequins 1.10
5 London Irish vs. Bristol Jan 09 London Irish 8.20


January 1, 2023

Briefly

  • The “Great Kiwi Christmas Survey” led to stories at Herald, Newshub, Farmers Weekly, and Radio NZ on what people were eating for their Christmas meal.  The respondents for the “Great Kiwi Christmas Survey” were variously described as “over 1000”, “over 1800”, and “over 3300” Kiwis, which seems a bit vague. According to newsroom, this was actually a bogus poll: “We promoted the survey through social media channels and sent the survey to those people who had signed up to receive information from us,” concedes Lisa Moloney, the promotions manager for Retail Meat NZ and Beef + Lamb NZ.  Headlines based on bogus polls aren’t ever ok — even when you don’t think the facts really matter. Newsroom argued that the results under-represented vegetarians, which is plausible, but you can’t really tell from the data presented on the number of vegetarians. Not all Christmas meals at which vegetarians are present will be centred around plant-based food, as any vegetarian can tell you.
  • Stuff, with the help of Auckland Transport, wrote about Auckland’s most prolific public transport user. Apparently, someone took 3400 trips over a year.  It’s surprising that’s even possible: nearly ten trips per day, every day,  and since the person is doing this on a gold card, starting no earlier than 9am on weekdays.  Assuming the numbers are correct — actually, whether the numbers are correct or not — it’s also a bit disturbing that this analysis was done.  The summaries of typical and top 100 users seem a lot more reasonable. The piece says “Stuff asked to interview the person, however Auckland Transport would not reveal their identity for privacy reasons.”, which is good, but you might want them not to be in a position to reveal it.
  • “Support for low-income housing followed a similar pattern, with broad approval for building it someplace in the country (82 percent) but much less for building it locally (65 percent)” at 538. There should be a word for this.
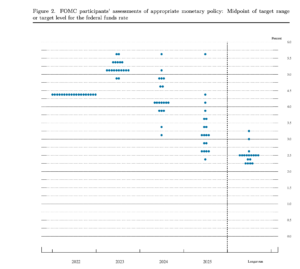
  • Interesting discussion on the Slate Money podcast about a data display, the “Fed Dot Plot”, which shows the best guesses of members of the Federal Reserve Open Market Committee as to what interest rates they will want in the future; each dot is one person.  The Fed is trying to de-emphasise this graph at the moment — partly because people tend to over-interpret it. Importantly, there’s no individual uncertainty shown, and there’s no way to tell how much of the difference between people is due to difference in what they think the economic situation will be and how much is due to differences in how they expect they will want to react to it.
December 31, 2022

Death by Chocolate?

The BBC: Hershey sued in US over metal in dark chocolate claim. 

This is a slight variation on normal headline grammar:  Hershey isn’t being sued over something they claimed; they are being sued because Consumer Reports claims to have found surprisingly high concentrations of lead and cadmium in dark chocolate from a wide range of manufacturers, small and large, organic and conventional, fair-trade and … whatever the opposite of that is.  The cadmium seems to come from the soil — chocolate eaters are on the wrong end of phytoremediation here — and the experts don’t actually know where the lead comes from. Hershey is being sued because they’re a potentially rewarding target, not because they are more at fault than other chocolate makers.

So, how bad is it? Consumer Reports say that the heavy-metal concentrations exceed health standards if you eat an ounce (like, 30g) every day. To get this result, they used the strictest health thresholds they could find: as they phrase it, “CR’s scientists believe that California’s levels are the most protective available”.  We can look at how California computed its threshold (MADL) for cadmium — at least, how it did in 2001; it’s possible there’s a stricter threshold that I haven’t found on Google.  The procedure was to take the highest concentration with no observed adverse effects in animals, scale it by weight, and divide by 1000 for safety.  With cadmium, they didn’t have a no-effect study, they only had a study showing adverse effects, so they put in an extra factor of 10 to account for that.  So, the threshold we’re comparing to is 10,000 times lower than the lowest concentration definitely shown to be harmful.  The California law doesn’t say it’s dangerous to exceed this threshold; it says that if you’re under this threshold you’re so safe that you don’t have to warn consumers that there’s cadmium present. (PDF)

For chemicals known to the state to cause reproductive toxicity, an exemption from the warning requirement is provided by the Act when a person in the course of doing business is able to demonstrate that an exposure for which the person is responsible will have no observable reproductive effect, assuming exposure at 1,000 times the level in question

Presumably the same is basically true of lead.  Now, lead and cadmium are well worth avoiding, even at levels not specifically known to be harmful. Lead, in particular, seems to have small adverse effects even at very low concentrations.  But the level of risk from doses anywhere in the vicinity the California MADL is, by careful design, very low.

We can look at NZ dietary exposures to cadmium, in the incredibly-detailed NZ Total Diet Study (PDF). We’re averaging about 5.2 ug per kg of bodyweight per month for women, 6.6 for men, and 12 for 5-6year old kids. The provisional monthly tolerable dose given in that report is 25.

Our numbers are a bit  higher than France and Australia, a bit lower than Hong Kong, and about the same as Italy.  If you take the hypothetical 58kg woman used in the California regulatory maths, she would consume about 10 ug/day of cadmium. The California limit is 4.1 and the NZ limit is 48. So, an ounce of high-cadmium dark chocolate per day, if it’s, say, twice the California limit, is a significant fraction of the typical cadmium consumption, but well under any levels actually known to have health risks.

For years, the StatsChat rule on dark chocolate has been “If you’re eating it primarily for the health benefits, you’re doing it wrong”. That still seems to hold.


December 28, 2022

Rugby Premiership Predictions for Round 14

Team Ratings for Round 14

The basic method is described on my Department home page.
Here are the team ratings prior to this week’s games, along with the ratings at the start of the season.

Current Rating Rating at Season Start Difference
Leicester Tigers 5.36 7.93 -2.60
Sale Sharks 3.66 4.14 -0.50
Harlequins 3.09 3.92 -0.80
Gloucester 3.00 5.92 -2.90
Exeter Chiefs 2.24 3.67 -1.40
Northampton Saints 1.32 3.99 -2.70
Saracens 0.75 -5.00 5.80
London Irish 0.21 -1.65 1.90
Wasps -0.18 0.77 -1.00
Bristol -3.19 -2.43 -0.80
Bath -5.80 -9.15 3.30
Newcastle Falcons -7.69 -8.76 1.10
Worcester Warriors -11.69 -12.27 0.60


Performance So Far

So far there have been 62 matches played, 40 of which were correctly predicted, a success rate of 64.5%.
Here are the predictions for last week’s games.

Game Date Score Prediction Correct
1 London Irish vs. Saracens Dec 24 29 – 20 3.30 TRUE
2 Newcastle Falcons vs. Sale Sharks Dec 24 20 – 14 -8.40 FALSE
3 Exeter Chiefs vs. Bath Dec 25 20 – 15 13.50 TRUE
4 Leicester Tigers vs. Gloucester Dec 25 28 – 13 5.80 TRUE
5 Harlequins vs. Bristol Dec 28 12 – 15 12.40 FALSE


Predictions for Round 14

Here are the predictions for Round 14. The prediction is my estimated expected points difference with a positive margin being a win to the home team, and a negative margin a win to the away team.

Game Date Winner Prediction
1 Sale Sharks vs. Leicester Tigers Dec 31 Sale Sharks 2.80
2 Bath vs. Newcastle Falcons Jan 01 Bath 6.40
3 Saracens vs. Exeter Chiefs Jan 01 Saracens 3.00
4 Gloucester vs. London Irish Jan 01 Gloucester 7.30
5 Northampton Saints vs. Harlequins Jan 02 Northampton Saints 2.70


December 27, 2022

United Rugby Championship Predictions for Week 11

Team Ratings for Week 11

The basic method is described on my Department home page.
Here are the team ratings prior to this week’s games, along with the ratings at the start of the season.

Current Rating Rating at Season Start Difference
Leinster 17.20 16.79 0.40
Ulster 9.73 9.27 0.50
Bulls 8.20 7.84 0.40
Munster 8.07 9.78 -1.70
Stormers 7.30 7.14 0.20
Sharks 5.23 6.95 -1.70
Edinburgh 3.44 3.58 -0.10
Connacht 1.23 -1.60 2.80
Glasgow 1.04 -0.00 1.00
Lions -1.65 -1.74 0.10
Ospreys -2.00 -0.83 -1.20
Benetton -4.54 -3.68 -0.90
Cardiff Rugby -4.87 -7.42 2.60
Scarlets -5.30 -1.23 -4.10
Dragons -9.52 -11.81 2.30
Zebre -17.52 -16.99 -0.50


Performance So Far

So far there have been 77 matches played, 60 of which were correctly predicted, a success rate of 77.9%.
Here are the predictions for last week’s games.

Game Date Score Prediction Correct
1 Sharks vs. Lions Dec 24 37 – 10 9.40 TRUE
2 Stormers vs. Bulls Dec 24 37 – 27 2.30 TRUE
3 Connacht vs. Ulster Dec 24 20 – 22 -5.10 TRUE
4 Glasgow vs. Edinburgh Dec 24 16 – 10 0.50 TRUE
5 Benetton vs. Zebre Dec 25 38 – 5 15.50 TRUE
6 Dragons vs. Cardiff Rugby Dec 27 24 – 29 0.40 FALSE
7 Ospreys vs. Scarlets Dec 27 34 – 14 6.00 TRUE
8 Munster vs. Leinster Dec 27 19 – 20 -6.20 TRUE


Predictions for Week 11

Here are the predictions for Week 11. The prediction is my estimated expected points difference with a positive margin being a win to the home team, and a negative margin a win to the away team.

Game Date Winner Prediction
1 Edinburgh vs. Glasgow Dec 31 Edinburgh 6.40
2 Zebre vs. Benetton Dec 31 Benetton -9.00
3 Sharks vs. Bulls Jan 01 Sharks 1.00
4 Stormers vs. Lions Jan 01 Stormers 12.90
5 Cardiff Rugby vs. Ospreys Jan 02 Cardiff Rugby 1.10
6 Scarlets vs. Dragons Jan 02 Scarlets 8.20
7 Ulster vs. Munster Jan 02 Ulster 5.70
8 Leinster vs. Connacht Jan 02 Leinster 20.00


Top 14 Predictions for Round 14

Team Ratings for Round 14

The basic method is described on my Department home page.
Here are the team ratings prior to this week’s games, along with the ratings at the start of the season.

Current Rating Rating at Season Start Difference
Stade Toulousain 7.65 6.34 1.30
La Rochelle 5.96 6.88 -0.90
Montpellier 5.04 4.18 0.90
Racing 92 4.64 4.86 -0.20
Toulon 4.11 4.09 0.00
Bordeaux Begles 4.00 5.27 -1.30
Stade Francais 3.55 -1.05 4.60
Clermont 2.35 4.05 -1.70
Castres Olympique 1.86 2.87 -1.00
Lyon 1.61 3.10 -1.50
Section Paloise -0.78 -2.12 1.30
Aviron Bayonnais -1.71 -4.26 2.50
USA Perpignan -4.94 -2.75 -2.20
Brive -6.08 -4.20 -1.90


Performance So Far

So far there have been 91 matches played, 65 of which were correctly predicted, a success rate of 71.4%.
Here are the predictions for last week’s games.

Game Date Score Prediction Correct
1 Toulon vs. Lyon Dec 23 21 – 3 8.00 TRUE
2 Brive vs. Clermont Dec 24 20 – 16 -2.60 FALSE
3 La Rochelle vs. Bordeaux Begles Dec 24 8 – 12 9.40 FALSE
4 Montpellier vs. USA Perpignan Dec 24 38 – 10 15.60 TRUE
5 Section Paloise vs. Aviron Bayonnais Dec 24 22 – 22 8.30 FALSE
6 Stade Toulousain vs. Castres Olympique Dec 24 22 – 18 13.20 TRUE
7 Racing 92 vs. Stade Francais Dec 25 10 – 48 10.30 FALSE


Predictions for Round 14

Here are the predictions for Round 14. The prediction is my estimated expected points difference with a positive margin being a win to the home team, and a negative margin a win to the away team.

Game Date Winner Prediction
1 Bordeaux Begles vs. Montpellier Dec 31 Bordeaux Begles 5.50
2 Aviron Bayonnais vs. Toulon Jan 01 Aviron Bayonnais 0.70
3 Castres Olympique vs. Racing 92 Jan 01 Castres Olympique 3.70
4 Lyon vs. Brive Jan 01 Lyon 14.20
5 Stade Francais vs. Section Paloise Jan 01 Stade Francais 10.80
6 USA Perpignan vs. La Rochelle Jan 01 La Rochelle -4.40
7 Clermont vs. Stade Toulousain Jan 02 Clermont 1.20


December 7, 2022

Good reporting of numbers

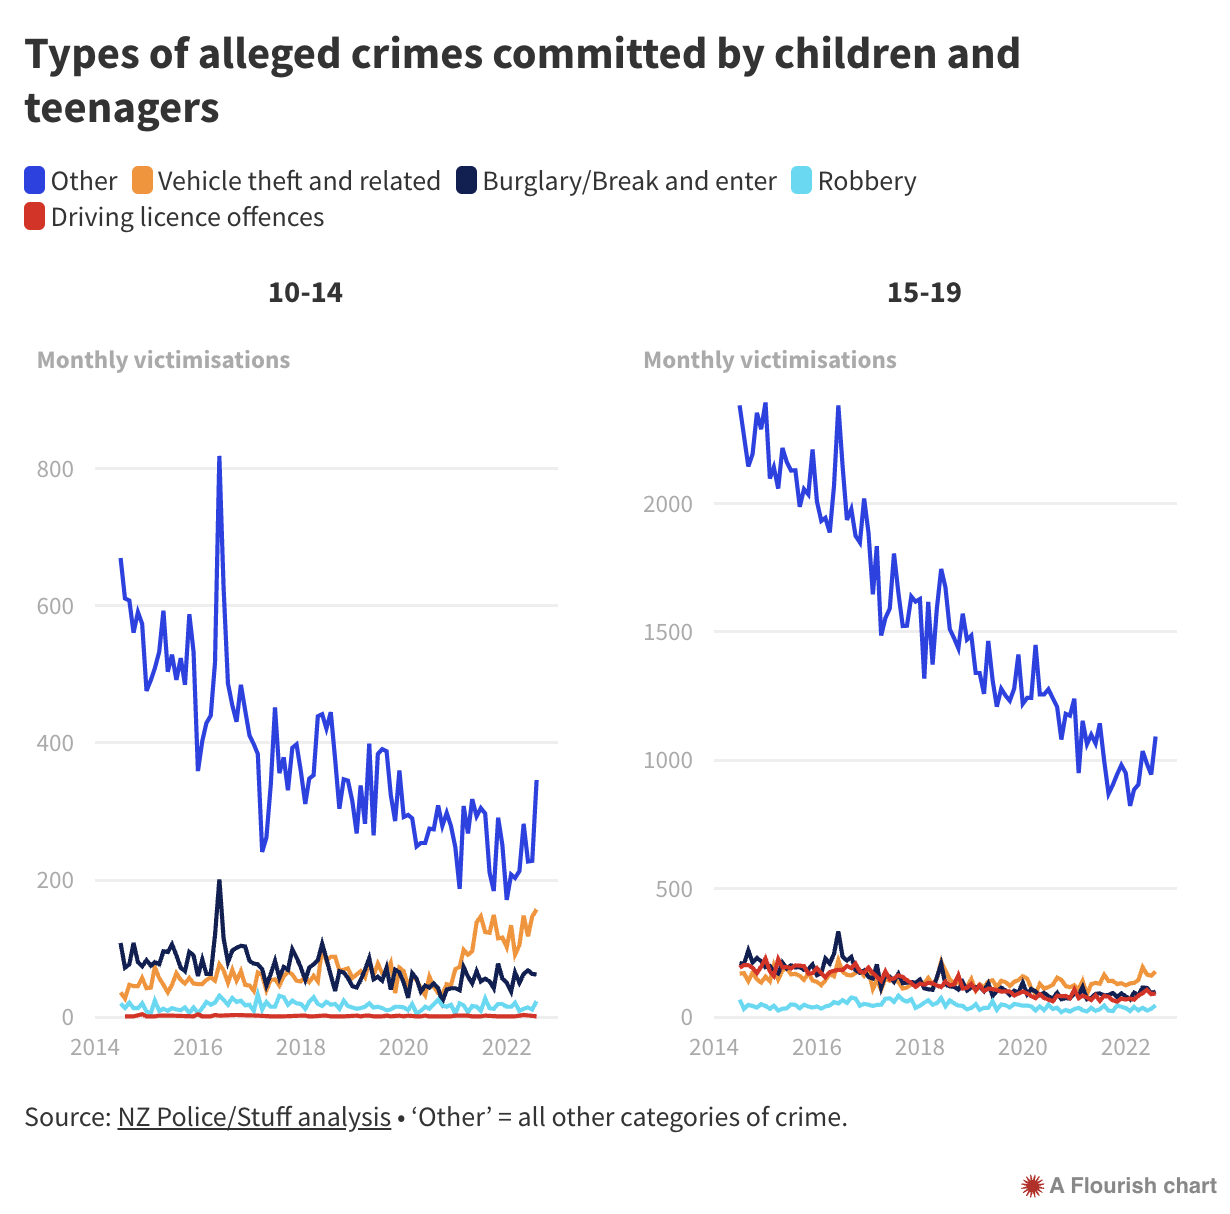
Stuff has a new fact-check column, “The Whole Truth”, and there’s a good example with discussion of youth crime trends, by James Halpin.

The graphs are just the sort of thing I use and recommend: enough history and (where appropriate) enough context to see what trends are just continuing and where things might have changed

It’s clear that the orange line in the left panel is different from basically everything else.  It looks as though the blue line might be going up, but it’s clearly still lower than it was in recent years.

That is, one category of crime in one age group is up.  Overall, robberies and burglaries, even those specifically committed by young people, aren’t increasing, but these vehicle crimes are.  They go on to say that ram-raids by young people are up; the absolute numbers are small, but these are serious crimes, with damage out of proportion to the amount stolen. It’s unlikely to be reporting bias — again, these are serious crimes that would usually be reported.

The data can’t really support a general ‘kids today’ narrative, but there is a real, specific, problem.

December 6, 2022

Briefly

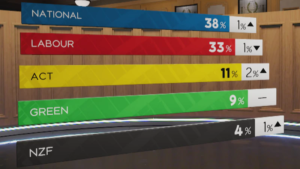
  • I’ve often complained about misleading bar graphs in reporting electoral opinion polls. 1News just punted on the whole issue with this:
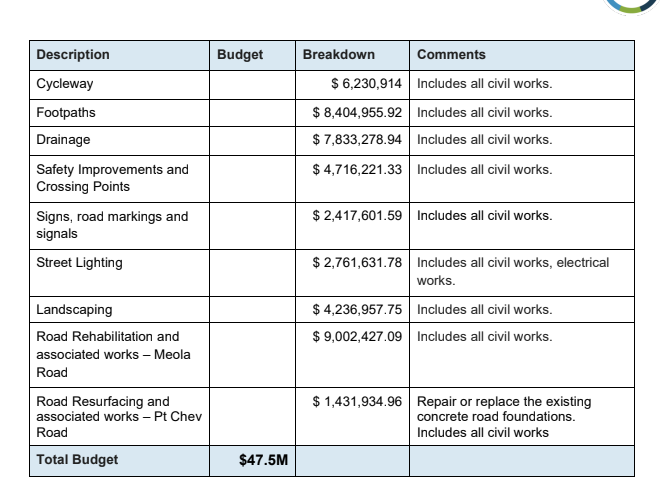
  • The cost of the Meola Road rebuild, $47.5 million, has been inaccurately portrayed as the cost of the bike lane that’s a minor component of it. Twitter user @ArcCyclist got the actual breakdown from the Council:

    While I’m at it, I do want to note one way it’s a bad table: the cycleway number is given to whole dollars, with everything else given in cents, so it looks even smaller than it really is. You usually don’t want to delete trailing zeroes in a table.
  • The ESR Covid wastewater dashboard is now at poops.nz. Yes, really.
  • There’s a new “technical report for future UK Chief Medical Officers, Government Chief Scientific Advisers, National Medical Directors and public health leaders in a pandemic” from the UK. Even if you aren’t among that exalted company, some of the information may be useful to public citizens as well
  • The Ministry of Health is seeking public comment on something it wrote about ‘precision health’. There might be StatsChat readers who have reckons.
  • Eric Crampton notes that cost-benefit ratios for transport projects are defined in an idiosyncratic way that makes them hard to compare either with each other or with non-transport projects.
  • The first drug to convincingly delay Type I diabetes onset has been approved. The average benefit is about two years, and the treatment will be marketed at US$200,000.  Cost-effectiveness research suggests this is way more than it’s worth for most people, even in the US where insulin for Type I diabetes is very expensive.