March 25, 2025

Super Rugby Predictions for Week 7

Team Ratings for Week 7

The basic method is described on my Department home page.
Here are the team ratings prior to this week’s games, along with the ratings at the start of the season.

Current Rating Rating at Season Start Difference
Blues 12.15 14.92 -2.80
Chiefs 11.94 11.43 0.50
Crusaders 10.46 8.99 1.50
Hurricanes 8.24 10.97 -2.70
Brumbies 4.98 6.19 -1.20
Reds 2.02 1.35 0.70
Highlanders -2.08 -2.50 0.40
Waratahs -4.41 -5.17 0.80
Western Force -5.74 -6.41 0.70
Fijian Drua -7.36 -7.98 0.60
Moana Pasifika -9.67 -11.25 1.60


Performance So Far

So far there have been 30 matches played, 21 of which were correctly predicted, a success rate of 70%.
Here are the predictions for last week’s games.

Game Date Score Prediction Correct
1 Moana Pasifika vs. Chiefs Mar 21 35 – 50 -18.60 TRUE
2 Highlanders vs. Reds Mar 22 23 – 29 0.90 FALSE
3 Blues vs. Crusaders Mar 22 19 – 42 7.30 FALSE
4 Waratahs vs. Brumbies Mar 22 28 – 23 -6.90 FALSE
5 Western Force vs. Fijian Drua Mar 23 52 – 15 2.80 TRUE


Predictions for Week 7

Here are the predictions for Week 7. The prediction is my estimated expected points difference with a positive margin being a win to the home team, and a negative margin a win to the away team.

Game Date Winner Prediction
1 Hurricanes vs. Waratahs Mar 28 Hurricanes 16.70
2 Brumbies vs. Highlanders Mar 28 Brumbies 11.10
3 Crusaders vs. Moana Pasifika Mar 29 Crusaders 23.60
4 Reds vs. Western Force Mar 29 Reds 11.30


Rugby Premiership Predictions for Round 13

Team Ratings for Round 13

The basic method is described on my Department home page.
Here are the team ratings prior to this week’s games, along with the ratings at the start of the season.

Current Rating Rating at Season Start Difference
Bath 13.68 5.55 8.10
Leicester Tigers 6.03 3.27 2.80
Bristol 5.33 9.58 -4.30
Sale Sharks 4.90 4.73 0.20
Harlequins 1.68 -2.73 4.40
Northampton Saints 1.54 7.50 -6.00
Gloucester 1.15 -9.04 10.20
Saracens -0.50 9.68 -10.20
Exeter Chiefs -2.16 1.23 -3.40
Newcastle Falcons -20.91 -19.02 -1.90


Performance So Far

So far there have been 60 matches played, 39 of which were correctly predicted, a success rate of 65%.
Here are the predictions for last week’s games.

Game Date Score Prediction Correct
1 Newcastle Falcons vs. Sale Sharks Mar 22 15 – 39 -18.10 TRUE
2 Bristol vs. Exeter Chiefs Mar 23 52 – 38 14.00 TRUE
3 Northampton Saints vs. Leicester Tigers Mar 23 0 – 33 10.80 FALSE
4 Saracens vs. Harlequins Mar 23 12 – 23 8.20 FALSE
5 Bath vs. Gloucester Mar 24 42 – 26 19.80 TRUE


Predictions for Round 13

Here are the predictions for Round 13. The prediction is my estimated expected points difference with a positive margin being a win to the home team, and a negative margin a win to the away team.

Game Date Winner Prediction
1 Bath vs. Harlequins Mar 30 Bath 18.50
2 Exeter Chiefs vs. Newcastle Falcons Mar 30 Exeter Chiefs 25.30
3 Gloucester vs. Bristol Mar 30 Gloucester 2.30
4 Leicester Tigers vs. Saracens Mar 30 Leicester Tigers 13.00
5 Sale Sharks vs. Northampton Saints Mar 30 Sale Sharks 9.90


NRL Predictions for Round 4

Team Ratings for Round 4

The basic method is described on my Department home page.
Here are the team ratings prior to this week’s games, along with the ratings at the start of the season.

Current Rating Rating at Season Start Difference
Storm 10.33 9.29 1.00
Panthers 8.05 8.50 -0.50
Sharks 6.11 5.10 1.00
Roosters 5.65 7.44 -1.80
Sea Eagles 4.00 2.97 1.00
Cowboys 1.42 4.11 -2.70
Bulldogs 1.09 0.07 1.00
Broncos -0.04 -1.82 1.80
Knights -0.88 -0.05 -0.80
Warriors -1.10 -1.68 0.60
Raiders -2.98 -3.61 0.60
Dolphins -3.48 -1.96 -1.50
Rabbitohs -4.13 -4.35 0.20
Titans -4.90 -5.50 0.60
Dragons -5.17 -4.55 -0.60
Eels -5.67 -3.02 -2.70
Wests Tigers -8.30 -10.97 2.70


Performance So Far

So far there have been 24 matches played, 14 of which were correctly predicted, a success rate of 58.3%.
Here are the predictions for last week’s games.

Game Date Score Prediction Correct
1 Storm vs. Panthers Mar 20 30 – 24 5.10 TRUE
2 Warriors vs. Roosters Mar 21 14 – 6 -4.40 FALSE
3 Broncos vs. Cowboys Mar 21 26 – 16 0.60 TRUE
4 Sharks vs. Rabbitohs Mar 22 27 – 12 12.90 TRUE
5 Dolphins vs. Wests Tigers Mar 22 18 – 30 9.70 FALSE
6 Titans vs. Knights Mar 22 26 – 6 -3.00 FALSE
7 Eels vs. Bulldogs Mar 23 8 – 16 -3.20 TRUE
8 Sea Eagles vs. Raiders Mar 23 40 – 12 8.20 TRUE


Predictions for Round 4

Here are the predictions for Round 4. The prediction is my estimated expected points difference with a positive margin being a win to the home team, and a negative margin a win to the away team.

Game Date Winner Prediction
1 Rabbitohs vs. Panthers Mar 27 Panthers -9.20
2 Roosters vs. Titans Mar 28 Roosters 13.50
3 Dolphins vs. Broncos Mar 28 Broncos -3.40
4 Dragons vs. Storm Mar 29 Storm -12.50
5 Cowboys vs. Raiders Mar 29 Cowboys 7.40
6 Sharks vs. Bulldogs Mar 29 Sharks 8.00
7 Sea Eagles vs. Eels Mar 30 Sea Eagles 12.70
8 Wests Tigers vs. Warriors Mar 30 Warriors -3.70


If you see a fork in the road

From Pew Research, a bizarre error

A few Reddit users shared screenshots from a variety of surveys, where questions that should have offered answer options of “yes” and “no” instead offered the choices “forks” and “no.”

In summary: web browsers may offer you the option to translate web pages automatically from languages you don’t read to languages you do read.  That is, they have the option to silently rewrite web pages before showing them to you. They aren’t 100% reliable either in guessing which web pages are actually in a foreign language and need translating or in translating those pages to, as it might be, English.

March 23, 2025

Briefly

Screen time

In the Herald this week

New Zealanders are spending more time online than ever, with 50% of respondents spending four or more hours of their leisure time on the internet each day, according to a study commissioned by InternetNZ.

But that doesn’t necessarily mean doom-scrolling TikTok.

The result is partly because of the changing way that more traditional media is delivered.

Watching a couple of hours of TVNZ+ on the smart TV in your lounge or listening to Spotify during your commute counts towards your total.

That’s a nice start — giving the headline result and then contextualising it.  I was hoping then to see whether streaming more traditional media did in fact account for the increase. No more mention.

If we look at the report itself, there’s a good description of the survey: a sample of 1001 people, sampled and weighted to be representative of the subset of the NZ population who are online.  What does the report say about the increase?

Half of New Zealanders* (50%) spend four or more hours a day on the internet for personal
use.
This is a slight, but not statistically significant, rise from 2023 findings.

In 2023 the number was 46%, and a four percentage point change is relatively unimpressive compared to the sampling uncertainty.  The report doesn’t estimate how long we spend doing each activity on the internet, but the proportion of people who use the internet for streaming is about the same this year as last year or maybe slightly higher (42% vs 39%)

The report is generally interesting and useful, with the usual caveat that it’s self-reported — people may not be entirely accurate when you ask them how much time they spend online or how much they know about AI or whatever.

March 19, 2025

Super Rugby Predictions for Week 6

Team Ratings for Week 6

The basic method is described on my Department home page.
Here are the team ratings prior to this week’s games, along with the ratings at the start of the season.

Current Rating Rating at Season Start Difference
Blues 13.23 14.92 -1.70
Chiefs 12.20 11.43 0.80
Crusaders 9.39 8.99 0.40
Hurricanes 8.24 10.97 -2.70
Brumbies 5.49 6.19 -0.70
Reds 1.54 1.35 0.20
Highlanders -1.60 -2.50 0.90
Waratahs -4.92 -5.17 0.30
Fijian Drua -6.18 -7.98 1.80
Western Force -6.92 -6.41 -0.50
Moana Pasifika -9.93 -11.25 1.30


Performance So Far

So far there have been 25 matches played, 19 of which were correctly predicted, a success rate of 76%.
Here are the predictions for last week’s games.

Game Date Score Prediction Correct
1 Highlanders vs. Hurricanes Mar 14 18 – 20 -7.00 TRUE
2 Brumbies vs. Fijian Drua Mar 14 38 – 21 14.90 TRUE
3 Crusaders vs. Western Force Mar 15 55 – 33 20.00 TRUE
4 Chiefs vs. Blues Mar 15 32 – 31 2.70 TRUE
5 Reds vs. Waratahs Mar 15 35 – 15 9.00 TRUE


Predictions for Week 6

Here are the predictions for Week 6. The prediction is my estimated expected points difference with a positive margin being a win to the home team, and a negative margin a win to the away team.

Game Date Winner Prediction
1 Moana Pasifika vs. Chiefs Mar 21 Chiefs -18.60
2 Highlanders vs. Reds Mar 22 Highlanders 0.90
3 Blues vs. Crusaders Mar 22 Blues 7.30
4 Waratahs vs. Brumbies Mar 22 Brumbies -6.90
5 Western Force vs. Fijian Drua Mar 23 Western Force 2.80


NRL Predictions for Round 3

Team Ratings for Round 3

The basic method is described on my Department home page.
Here are the team ratings prior to this week’s games, along with the ratings at the start of the season.

Current Rating Rating at Season Start Difference
Storm 10.26 9.29 1.00
Panthers 8.12 8.50 -0.40
Roosters 6.25 7.44 -1.20
Sharks 5.94 5.10 0.80
Sea Eagles 3.13 2.97 0.20
Cowboys 1.91 4.11 -2.20
Bulldogs 0.81 0.07 0.70
Knights 0.10 -0.05 0.10
Broncos -0.53 -1.82 1.30
Warriors -1.70 -1.68 -0.00
Raiders -2.11 -3.61 1.50
Dolphins -2.55 -1.96 -0.60
Rabbitohs -3.97 -4.35 0.40
Dragons -5.17 -4.55 -0.60
Eels -5.39 -3.02 -2.40
Titans -5.88 -5.50 -0.40
Wests Tigers -9.24 -10.97 1.70


Performance So Far

So far there have been 16 matches played, 9 of which were correctly predicted, a success rate of 56.2%.
Here are the predictions for last week’s games.

Game Date Score Prediction Correct
1 Knights vs. Dolphins Mar 13 26 – 12 4.70 TRUE
2 Warriors vs. Sea Eagles Mar 14 36 – 16 -3.30 FALSE
3 Panthers vs. Roosters Mar 14 32 – 38 6.00 FALSE
4 Dragons vs. Rabbitohs Mar 15 24 – 25 2.30 FALSE
5 Cowboys vs. Sharks Mar 15 12 – 36 1.10 FALSE
6 Raiders vs. Broncos Mar 15 32 – 22 0.40 TRUE
7 Eels vs. Wests Tigers Mar 16 6 – 32 9.60 FALSE
8 Bulldogs vs. Titans Mar 16 40 – 24 8.90 TRUE


Predictions for Round 3

Here are the predictions for Round 3. The prediction is my estimated expected points difference with a positive margin being a win to the home team, and a negative margin a win to the away team.

Game Date Winner Prediction
1 Storm vs. Panthers Mar 20 Storm 5.10
2 Warriors vs. Roosters Mar 21 Roosters -4.40
3 Broncos vs. Cowboys Mar 21 Broncos 0.60
4 Sharks vs. Rabbitohs Mar 22 Sharks 12.90
5 Dolphins vs. Wests Tigers Mar 22 Dolphins 9.70
6 Titans vs. Knights Mar 22 Knights -3.00
7 Eels vs. Bulldogs Mar 23 Bulldogs -3.20
8 Sea Eagles vs. Raiders Mar 23 Sea Eagles 8.20


AFL Predictions for Week 3

Team Ratings for Week 3

The basic method is described on my Department home page.
Here are the team ratings prior to this week’s games, along with the ratings at the start of the season.

Current Rating Rating at Season Start Difference
Hawthorn Hawks 26.00 21.95 4.00
Brisbane Lions 22.59 22.65 -0.10
Geelong Cats 18.82 15.04 3.80
Western Bulldogs 15.48 18.20 -2.70
Collingwood 11.79 5.39 6.40
GWS Giants 8.43 9.08 -0.70
Sydney Swans 7.23 12.60 -5.40
Adelaide Crows 6.04 2.69 3.30
Port Adelaide Power 2.61 7.63 -5.00
Fremantle Dockers 2.21 5.99 -3.80
Carlton Blues 1.73 5.01 -3.30
Melbourne Demons -0.94 -0.21 -0.70
Gold Coast Suns -1.98 -6.41 4.40
St Kilda Saints -2.46 0.89 -3.30
Essendon Bombers -8.76 -10.15 1.40
Richmond Tigers -27.72 -31.00 3.30
North Melbourne -34.37 -37.08 2.70
West Coast Eagles -39.10 -34.67 -4.40


Performance So Far

So far there have been 11 matches played, 7 of which were correctly predicted, a success rate of 63.6%.
Here are the predictions for last week’s games.

Game Date Score Prediction Correct
1 Richmond Tigers vs. Carlton Blues Mar 13 82 – 69 -36.00 FALSE
2 Hawthorn Hawks vs. Essendon Bombers Mar 14 111 – 85 37.50 TRUE
3 Geelong Cats vs. Fremantle Dockers Mar 15 147 – 69 20.00 TRUE
4 Sydney Swans vs. Brisbane Lions Mar 15 82 – 86 -4.50 TRUE
5 Collingwood vs. Port Adelaide Power Mar 15 136 – 45 10.10 TRUE
6 Western Bulldogs vs. North Melbourne Mar 15 113 – 97 55.30 TRUE
7 Adelaide Crows vs. St Kilda Saints Mar 16 135 – 72 12.80 TRUE
8 Melbourne Demons vs. GWS Giants Mar 16 74 – 77 3.10 FALSE
9 West Coast Eagles vs. Gold Coast Suns Mar 16 49 – 136 -17.30 TRUE


Predictions for Week 3

Here are the predictions for Week 3. The prediction is my estimated expected points difference with a positive margin being a win to the home team, and a negative margin a win to the away team.

Game Date Winner Prediction
1 Carlton Blues vs. Hawthorn Hawks Mar 20 Hawthorn Hawks -24.30
2 Western Bulldogs vs. Collingwood Mar 21 Western Bulldogs 3.70
3 Essendon Bombers vs. Adelaide Crows Mar 22 Adelaide Crows -3.80
4 Port Adelaide Power vs. Richmond Tigers Mar 22 Port Adelaide Power 41.30
5 St Kilda Saints vs. Geelong Cats Mar 22 Geelong Cats -10.30
6 Brisbane Lions vs. West Coast Eagles Mar 23 Brisbane Lions 72.70
7 North Melbourne vs. Melbourne Demons Mar 23 Melbourne Demons -33.40
8 Fremantle Dockers vs. Sydney Swans Mar 23 Fremantle Dockers 6.00


March 18, 2025

Good news graph

The Washington Post writes about cervical cancer: the vaccine works.  This isn’t new news: we know the vaccine stops infection with cancer-causing strains of the human papillomavirus (that’s why it was approved). We know the vaccine stops cervical cancer: the first reliable data came out a few years ago.  Now the first cohort of vaccinated girls is old enough that we’re seeing the reduction in cervical cancer deaths.

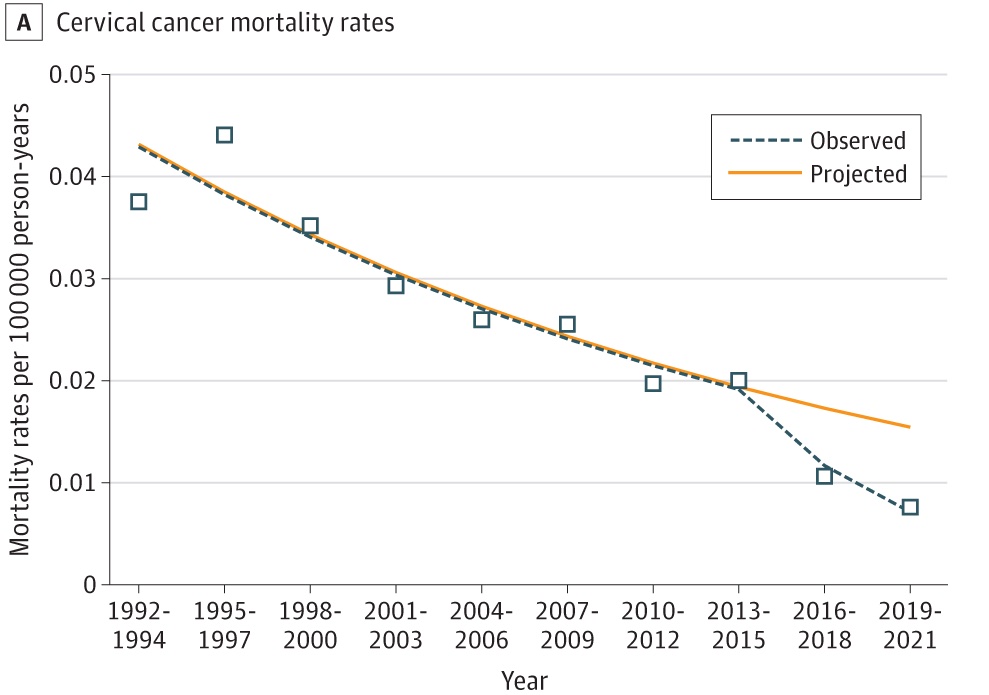
Using data from the National Center for Health Statistics, researchers looked at cervical cancer deaths in three-year blocks of time. Between 1992 and 2021, there were 398 cervical cancer deaths reported among women younger than 25. During the period of 1992-1994 to 2013-2015, mortality from cervical cancer gradually declined 3.7 percent each year. The period of 2013-2015 to 2019-2021 saw an even greater drop to 15.2 percent annually, according to the study.

The number of deaths decreased from 55 in 1992-1994 to 35 in 2013-2015 to 13 in 2019-2021.

“Assuming that the trend from 1992-1994 to 2013-2015 would have continued, an estimated 26 additional cervical cancer deaths would have been expected to occur between 2016 to 2021, based on projected mortality rates,” the authors wrote.

That description seems like a hard way to present this graph from the article in JAMA (perhaps copyright is the problem?)

The squares are what happened in reality. The orange line shows the downward trend we were seeing before the vaccine, due to better testing and treatment.  As you can see, the last two squares, post-vaccine, are dramatically below the orange line. Below is good.