March 7, 2016

Crime reports in NZ

The Herald Insights section has a multi-day exploration of police burglary reports, starting with a map at the Census meshblock level.

burglary

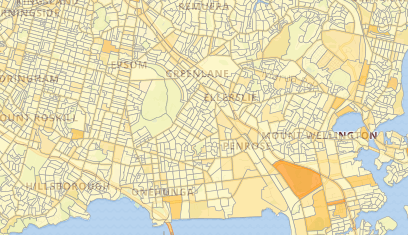
When you have counts of things on a map there’s always an issue of denominators and areas.  There’s the “one cow, one vote” phenomenon where rural areas dominate the map, and also the question of whether to show the raw count, the fraction of the population, or something else.  Burglaries are especially tricky in this context, because the crime location need not be a household, and the perpetrator need not live nearby, so the meshblock population really isn’t the right denominator.  The Herald hasn’t standardised, which I think is a reasonable default.

It’s also an opportunity to link again to Graeme Edgeler’s discussions of  why ‘burglary’ is a wider category than most people realise.

Redesign of a graphic

This graph, from the Wall Street Journal last year, was one of a series showing the impact of vaccination

wsj-polio-dataviz

Randall Olson looks at ways to redesign it to communicate the numbers more effectively.

March 3, 2016

Soft drink doses

From the Herald today

Coca-Cola would prefer to see more people drinking less of its products rather than a few people drinking a lot. So one can a week is quite alright, according to the folks from Coke.

So, how does that compare to current consumption? We don’t know specifically for Coca-Cola, but Stuff gave figures a year ago for fizzy soft drinks

New Zealanders drank just under 73 litres of carbonated drinks each in 2014 – a fraction lower than Australia where the per-capita consumption sat just under 75 litres.

The figure excludes sports drinks, tea and coffee, and other soft drinks, and 73 litres a year breaks down to nearly four cans a week, and that’s averaged over the whole population. Averaged over just those who drink carbonated soft drinks it’s obviously going to be more.

Coca-Cola Amatil would probably be happy if people who don’t currently drink Coke started drinking a can a week, or if people switched to Coke from L&P, Fanta, or Six Barrel Soda Celery Tonic, but if everyone who drinks fizzy soft drinks regularly were to cut down to one can a week, the market would shrink a lot.

March 2, 2016

Better living through genetics

Q: So the Herald headline asks “Could this drug stop hair going grey?” Could it?

A: Which drug?

Q: The one in the story?

A: There isn’t a drug in the story.

Q: Ok, what is in the story and why do the Herald and the Daily Telegraph think it’s a drug?

A: There’s a gene. Called IRF4

Q: So people can be given this gene and their hair will stop going grey?

A: No, everyone already has this gene. That’s how genes work.

Q: You know what I mean. The version of the gene that stops greying; are the scientists are going to give people that?

A: No.

Q: What, then?

A: “They are confident that it will be possible to produce drugs or cosmetics to switch it off.”

Q: How confident should I be?

A: Well, we’ve known one of the gene responsible for baldness for about a decade…

Q: So I shouldn’t hold my breath. How much of hair greyness does this genetic variant explain?

A: Among people old enough for it to matter, about 0.1 points on a 5-point scale where most people were 1 or 2.

Q: That doesn’t sound like that much.

A: A lot more of the hair greyness seemed to be genetic, just not explained by that one genetic variant

Q: Doesn’t that make it worse for trying to make drugs?

A: Yes, but more interesting for science

Q: I think you have your priorities wrong.

A: Then you won’t be interested in the stories that talk about the real point of the research and its findings.

Briefly

  • From STAT news, a story about doctors who promote treatments on Twitter without disclosing significant conflicts of interest. “Simon said the extensive work he does for drug companies, including helping them develop drugs, would be too long to include as a disclosure in social media.
    (At the other extreme, Stephen Senn’s disclosure statement)
  • This (good) Huffington Post story about good and bad ways to give away large sums of money has an.. um..unique graphic about halfway throughff
    The bunch of children on the right represent donation by the Ford Foundation; the guy on the left represents payments to consultants. The blue and brown flowers are actually coins, and they surge up and down in the silhouettes in what must be intended to be a helpful way? (via @felixsalmon)
  • Overly-sensitive tests: assays for cocaine: a US drug labs was asked to develop a forensic test for cocaine on money that could be used as evidence against drug traffickers. The test worked, but it returned positive results on seven of 21 random samples of destroyed $50 notes removed from circulation.
  • There was a widely circulated story (Guardian, Fusion) reporting a study that showed women on Github wrote better code but were less likely to have it accepted. The truth is more complicated: here’s one discussion including the key graph. (via Heather Piwowar)
  • The Newmarket Business Association has released a poll on the flag referendum where they surveyed “Newmarket residents, commuters, and workers”.  They found 40% support for the new flag,  but didn’t explain why anyone would care about their particular sample.

Super 18 Predictions for Round 2

Team Ratings for Round 2

The basic method is described on my Department home page.

Here are the team ratings prior to this week’s games, along with the ratings at the start of the season.

Current Rating Rating at Season Start Difference
Crusaders 8.84 9.84 -1.00
Highlanders 6.15 6.80 -0.60
Brumbies 5.68 3.15 2.50
Waratahs 4.99 4.88 0.10
Hurricanes 4.73 7.26 -2.50
Chiefs 3.68 2.68 1.00
Stormers 0.60 -0.62 1.20
Sharks -0.05 -1.64 1.60
Lions -1.28 -1.80 0.50
Bulls -1.96 -0.74 -1.20
Blues -4.86 -5.51 0.60
Rebels -5.89 -6.33 0.40
Force -8.88 -8.43 -0.40
Cheetahs -9.62 -9.27 -0.30
Jaguares -9.66 -10.00 0.30
Reds -9.92 -9.81 -0.10
Sunwolves -10.53 -10.00 -0.50
Kings -15.25 -13.66 -1.60


Performance So Far

So far there have been 9 matches played, 4 of which were correctly predicted, a success rate of 44.4%.
Here are the predictions for last week’s games.

Game Date Score Prediction Correct
1 Blues vs. Highlanders Feb 26 33 – 31 -8.80 FALSE
2 Brumbies vs. Hurricanes Feb 26 52 – 10 -0.10 FALSE
3 Cheetahs vs. Jaguares Feb 26 33 – 34 4.70 FALSE
4 Sunwolves vs. Lions Feb 27 13 – 26 -4.20 TRUE
5 Crusaders vs. Chiefs Feb 27 21 – 27 10.70 FALSE
6 Waratahs vs. Reds Feb 27 30 – 10 18.20 TRUE
7 Force vs. Rebels Feb 27 19 – 25 1.40 FALSE
8 Kings vs. Sharks Feb 27 8 – 43 -8.50 TRUE
9 Stormers vs. Bulls Feb 27 33 – 9 3.60 TRUE


Predictions for Round 2

Here are the predictions for Round 2. The prediction is my estimated expected points difference with a positive margin being a win to the home team, and a negative margin a win to the away team.

Game Date Winner Prediction
1 Crusaders vs. Blues Mar 04 Crusaders 17.20
2 Brumbies vs. Waratahs Mar 04 Brumbies 4.20
3 Chiefs vs. Lions Mar 05 Chiefs 9.00
4 Highlanders vs. Hurricanes Mar 05 Highlanders 4.90
5 Reds vs. Force Mar 05 Reds 2.50
6 Bulls vs. Rebels Mar 05 Bulls 7.90
7 Cheetahs vs. Stormers Mar 05 Stormers -6.70
8 Sharks vs. Jaguares Mar 05 Sharks 13.60


NRL Predictions for Round 1

Team Ratings for Round 1

The basic method is described on my Department home page.

Here are the team ratings prior to this week’s games, along with the ratings at the start of the season.

Current Rating Rating at Season Start Difference
Roosters 11.20 11.20 -0.00
Cowboys 10.29 10.29 -0.00
Broncos 9.81 9.81 0.00
Storm 4.41 4.41 -0.00
Bulldogs 1.50 1.50 0.00
Sea Eagles 0.36 0.36 -0.00
Dragons -0.10 -0.10 -0.00
Raiders -0.55 -0.55 0.00
Sharks -1.06 -1.06 -0.00
Rabbitohs -1.20 -1.20 0.00
Panthers -3.06 -3.06 -0.00
Wests Tigers -4.06 -4.06 -0.00
Eels -4.62 -4.62 0.00
Knights -5.41 -5.41 0.00
Warriors -7.47 -7.47 -0.00
Titans -8.39 -8.39 -0.00


Predictions for Round 1

Here are the predictions for Round 1. The prediction is my estimated expected points difference with a positive margin being a win to the home team, and a negative margin a win to the away team.

Game Date Winner Prediction
1 Eels vs. Broncos Mar 03 Broncos -11.40
2 Sea Eagles vs. Bulldogs Mar 04 Sea Eagles 1.90
3 Raiders vs. Panthers Mar 05 Raiders 5.50
4 Wests Tigers vs. Warriors Mar 05 Wests Tigers 7.40
5 Cowboys vs. Sharks Mar 05 Cowboys 14.40
6 Roosters vs. Rabbitohs Mar 06 Roosters 15.40
7 Titans vs. Knights Mar 06 Titans 0.00
8 Storm vs. Dragons Mar 07 Storm 7.50


February 29, 2016

‘Cure’ exaggeration

A Herald headline says “Dementia cure just five years away – world expert“. That’s even worse than the Telegraph headline for the original piece “Dementia cure may be just five years away, says world expert“.

The ‘world expert’ is Dennis Gillings, an expert in clinical trials, who is the G8 ‘World Dementia Envoy’, so his opinions are worth listening to. What he says doesn’t really support the headline.

Dr Gillings… said progress was being made on treatments that might halt or reverse the progress of dementia, with some kind of brain training used to help rebuild lost neural pathways.

and

scientists increasingly believed it had been a mistake to treat dementia as one disease, saying it was likely that breakthroughs would come from targeting subtypes of the condition.

and

Saluting recent British investment in science, and the creation of a 150 million Dementia Research Institute, he said that, none the less, breakthroughs were more likely in the US, which put more money into research

If a cure was actually going to be available in five years you would have heard about its success in early clinical trials already. He’s talking about making scientific progress within five years to identify a cure, with breakthroughs still needed.

February 28, 2016

How I met your mother

Via Jolisa Gracewood on Twitter, a graph from Stanford sociologist Michael Rosenfeld on how people met their partners (click to embiggen)

met

Obviously the proportion who met online has increased — in the old days there weren’t many people on line. It’s still dramatic how fast the change happened, considering that ‘the year September never ended’, when AOL subscribers gained access to Usenet, was only 1993.  It’s also notable how everything else except ‘in a bar or restaurant’ has gone down.

Since this is StatsChat you should be asking how they got the data: it was a reasonably good survey. There’s a research paper, too (PDF).

You should also be worrying about the bump in ‘online’ in the mid-1980s. It’s ok. The paper says “This bump corresponds to two respondents. These two respondents first met their partners in the 1980s without the assistance of the Internet, and then used the Internet to reconnect later”


Forecasts and betting

The StatsChat rugby predictions are pretty good, but not different enough from general educated opinion that you could make serious money betting with them.

By contrast, there’s a professor of political science who has an election forecasting model with a 97+% chance that Trump will be president if he is the Republican nominee.

If you were in the UK or NZ, and you actually believed this predicted probability, you could go to PaddyPower.com and bet at 9/4 on Trump winning  and at 3/1 on Rubio being the nominee. If you bet $3x on Trump and hedge with $1x on Rubio, you’ll almost certainly get your money back if Trump isn’t the nominee, and the prediction says you’ll have a 97% chance of more than doubling your money if he is.

Since I’m not betting like that, you can deduce I think the 97% chance is wildly inflated.