March 20, 2016

Hard problems make bad news

Q: Did you see snake venom can cure Alzheimer’s Disease now?

A: I saw the story in Stuff.

Q: Do you have to get bitten by the pretty green snake?

A: No, you don’t, though you’d probably need the compound from the venom injected into your spine. And the snake isn’t green.

Q: So it’s mice? It looks green

A: The photo is of the wrong snake, and the research isn’t even in mice. The last sentence of the story says “The treatment will now be trialled in mice before it can be considered as a viable treatment for humans.”

Q: But it could work?

A: It could, though so far treatments that try to dismantle amyloid plaques have ranged from ineffective to actively harmful in treating the actual disease. There’s even a respectable hypothesis that amyloid starts off as a protective response against lurking bacteria or viruses that activate in the brain in old age. It’s all very unclear and depressing.

Q: But there seem to be lots of natural products that are promising cures. It’s not just the snakes, look at the ‘Read More’ links from the story:

ad

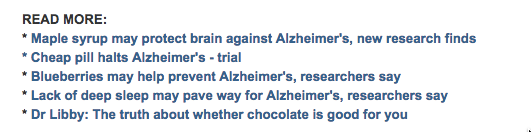
A: The chocolate link isn’t about Alzheimer’s at all. The maple syrup story talks about compounds in maple syrup, and the need for ‘further animal trials’. The ‘cheap pill’ trial “did not investigate whether resveratrol has any effect on memory or improving other symptoms of Alzheimer’s disease.”  The blueberries had a small effect in one tiny, short-term trial and a different small effect in another tiny, short-term trial.  And the sleep disruption isn’t something you could do much about, even if it is more than correlation.

Q: So why are there all these unreliable or preliminary reports being published?

A: Because there isn’t any other good news. If you have a really hard problem, nearly all the people who say they have solutions will be wrong, and won’t have checked their solutions thoroughly.

Q: I see. It’s like aliens.

A: <blinks> Huh?

Q: Lots of serious researchers are looking for alien life, but all the people who say they’ve actually found it are talking about crop circles and UFOs, and everything else is just like “we’ve found a planet that’s not as far from being habitable as the previous ones were”

A: Pretty much.


March 18, 2016

What they aren’t telling you

Unfiltered.news is a beautiful visualisation of what news topics are less covered in your country (or any selected country) than on average for the world:

unfiltered

For a lot of these topics it will be obvious why they’re just not that relevant, but not always.

(via Harkanwal Singh)

March 17, 2016

Parental worry clickbait

From the ‘Parenting’ section of the Stuff Life & Style page:

Cduf0BaUsAEOhzt

That’s both wrong and implausible.  If Dravet syndrome, a serious epileptic condition, was about as common as, say, autism spectrum disorder, you’d have heard of it already.

The actual rate is about 1 in 20,000, two hundred times lower than the teaser says. If you click through to the story and read it carefully you’ll see that Dravet Syndrome is responsible for about 1% of childhood epilepsy.

So, how did the numbers get so badly messed up? Well, one contributing factor is probably that the story was taken from The Conversation, and whoever did the editing job didn’t read it carefully enough.  As seems to often happen with pieces taken from The Conversation, there’s no attribution either to the original publisher or the authors, and all but two of the nine links in the original have been scrubbed.

The Conversation encourages republication of the pieces they publish, but the Creative Commons license they use requires that republishers attribute the piece and indicate if changes have been made.  I don’t know if the NZ news sites have negotiated an alternative deal, but I can’t see why lack of attribution would be desirable — I thought the by-line was as sacred to journalists as to academics.


March 16, 2016

Super 18 Predictions for Round 4

Team Ratings for Round 4

The basic method is described on my Department home page.

Here are the team ratings prior to this week’s games, along with the ratings at the start of the season.

Current Rating Rating at Season Start Difference
Crusaders 8.71 9.84 -1.10
Brumbies 6.82 3.15 3.70
Highlanders 6.43 6.80 -0.40
Hurricanes 4.83 7.26 -2.40
Waratahs 4.22 4.88 -0.70
Chiefs 4.09 2.68 1.40
Stormers 0.20 -0.62 0.80
Sharks -0.03 -1.64 1.60
Lions -1.01 -1.80 0.80
Bulls -1.24 -0.74 -0.50
Blues -4.60 -5.51 0.90
Rebels -6.97 -6.33 -0.60
Force -8.15 -8.43 0.30
Jaguares -9.08 -10.00 0.90
Cheetahs -9.56 -9.27 -0.30
Reds -10.67 -9.81 -0.90
Sunwolves -10.79 -10.00 -0.80
Kings -16.44 -13.66 -2.80


Performance So Far

So far there have been 24 matches played, 15 of which were correctly predicted, a success rate of 62.5%.
Here are the predictions for last week’s games.

Game Date Score Prediction Correct
1 Blues vs. Hurricanes Mar 11 19 – 23 -6.20 TRUE
2 Force vs. Brumbies Mar 11 14 – 31 -10.70 TRUE
3 Highlanders vs. Lions Mar 12 34 – 15 10.40 TRUE
4 Rebels vs. Reds Mar 12 25 – 23 7.90 TRUE
5 Sunwolves vs. Cheetahs Mar 12 31 – 32 3.30 FALSE
6 Kings vs. Chiefs Mar 12 24 – 58 -14.10 TRUE
7 Stormers vs. Sharks Mar 12 13 – 18 4.90 FALSE


Predictions for Round 4

Here are the predictions for Round 4. The prediction is my estimated expected points difference with a positive margin being a win to the home team, and a negative margin a win to the away team.

Game Date Winner Prediction
1 Hurricanes vs. Force Mar 18 Hurricanes 17.00
2 Waratahs vs. Highlanders Mar 18 Waratahs 1.80
3 Bulls vs. Sharks Mar 18 Bulls 2.30
4 Sunwolves vs. Rebels Mar 19 Sunwolves 0.20
5 Crusaders vs. Kings Mar 19 Crusaders 29.10
6 Reds vs. Blues Mar 19 Blues -2.10
7 Lions vs. Cheetahs Mar 19 Lions 12.00
8 Stormers vs. Brumbies Mar 19 Brumbies -2.60
9 Jaguares vs. Chiefs Mar 19 Chiefs -9.20


NRL Predictions for Round 3

Team Ratings for Round 3

The basic method is described on my Department home page.

Here are the team ratings prior to this week’s games, along with the ratings at the start of the season.

Current Rating Rating at Season Start Difference
Broncos 9.46 9.81 -0.30
Cowboys 8.62 10.29 -1.70
Roosters 7.61 11.20 -3.60
Storm 4.28 4.41 -0.10
Rabbitohs 3.98 -1.20 5.20
Bulldogs 3.02 1.50 1.50
Sharks 1.30 -1.06 2.40
Raiders 0.12 -0.55 0.70
Dragons -1.41 -0.10 -1.30
Sea Eagles -2.23 0.36 -2.60
Wests Tigers -3.05 -4.06 1.00
Panthers -3.15 -3.06 -0.10
Eels -3.67 -4.62 1.00
Warriors -7.04 -7.47 0.40
Titans -7.45 -8.39 0.90
Knights -8.71 -5.41 -3.30


Performance So Far

So far there have been 16 matches played, 12 of which were correctly predicted, a success rate of 75%.
Here are the predictions for last week’s games.

Game Date Score Prediction Correct
1 Panthers vs. Bulldogs Mar 10 16 – 18 -3.40 TRUE
2 Broncos vs. Warriors Mar 11 25 – 10 21.40 TRUE
3 Raiders vs. Roosters Mar 12 21 – 20 -5.40 FALSE
4 Rabbitohs vs. Knights Mar 12 48 – 6 11.60 TRUE
5 Eels vs. Cowboys Mar 12 20 – 16 -11.40 FALSE
6 Sharks vs. Dragons Mar 13 30 – 2 2.20 TRUE
7 Storm vs. Titans Mar 13 34 – 16 14.10 TRUE
8 Wests Tigers vs. Sea Eagles Mar 14 36 – 22 0.30 TRUE


Predictions for Round 3

Here are the predictions for Round 3. The prediction is my estimated expected points difference with a positive margin being a win to the home team, and a negative margin a win to the away team.

Game Date Winner Prediction
1 Cowboys vs. Roosters Mar 17 Cowboys 4.00
2 Bulldogs vs. Eels Mar 18 Bulldogs 9.70
3 Knights vs. Raiders Mar 19 Raiders -5.80
4 Panthers vs. Broncos Mar 19 Broncos -9.60
5 Titans vs. Wests Tigers Mar 19 Wests Tigers -1.40
6 Warriors vs. Storm Mar 20 Storm -7.30
7 Dragons vs. Rabbitohs Mar 20 Rabbitohs -2.40
8 Sea Eagles vs. Sharks Mar 21 Sharks -0.50


March 15, 2016

Joseph Pulitzer on statistics in journalism

From the North American Review, May 1904, writing about the proposed School of Journalism at Columbia University.

Everybody says that statistics should be taught. But how ?

Statistics are not simply figures. It is said that nothing lies  like figures except facts. You want statistics to tell you the truth. You can find truth there if you know how to get at it, and  romance, human interest, humor and fascinating revelations as well. The journalist must know how to find all these things truth, of course, first. His figures must bear examination. It is much better to understate than to overstate his case, so that his critics and not himself may be put to confusion when they challenge him to verify his comparisons.

He must not read his statistics blindly; he must be able to test them by knowledge and by common sense. He must always be
on the alert to discover how far they can actually be trusted and what they really mean. The analysis of statistics to get at the essential truth of them has become a well-developed science whose principles are systematically taught. And what a fascinating science it is!

via Amelia McNamara and Mark Hansen.

Briefly

  • The Ombudsman has released guidelines on Official Information Act requests through social media (PDF). Summary: it’s still a question, so it still gets answered.
  • From NiemanLabs, how some news publishers are doing interactive graphics for mobile devices

And from XKCD: how much of various fluids does the US consume, using pipeline diameters to illustrate

pipelines

(Update: Yes, I realise this is the sort of bubble plot we usually say mean things about. Not the point, here).

March 14, 2016

Dementia and rugby

Dylan Cleaver has a feature story in the Herald on the Taranaki rugby team who won the Ranfurly Shield in 1964. Five of the 22 have been diagnosed with dementia. Early on in the process he asked me to comment on how surprising that was.

The key fact here is 1964: the five developed dementia fairly young, in their 60s and early 70s. That happens even in people who have no family history and no occupational risks, as I know personally, but it’s unusual.

I couldn’t find NZ data, but I did find a Dutch study (PDF, Table 3) estimating that a man who is alive and healthy at 55 has a 1.5% risk of diagnosed dementia by 70 and 3.2% by 75. There’s broadly similar data from the Framingham study in the US.   The chance of getting 5 or more out of 22 depends on exact ages and on how many died earlier of other causes, but if these were just 22 men chosen at random the chance would be less than 1 in 10,000 — probably much less.  People who know about rugby tell me the fact they were all in the back line is also relevant, and that makes the chance much smaller.

There are still at least two explanations. The first, obviously, is that rugby — at least as played in those days — caused similar cumulative brain damage to that seen in American football players. The second, though, is that we’re hearing about the 1964 Taranaki team partly because of the dementia cases — there wouldn’t have been this story if there had only been two cases, and there might have been a story about some other team instead. That is, it could be a combination of a tragic fluke and the natural human tendency to see patterns.  Statistics is bad at disentangling these; the issue crops up over and over again in cancer surveillance.

In the light of what has been seen in the US, I’d say it’s plausible that concussions contributed to the Taranaki cases.  There have already been changes to the game to reduce repeated concussions, which should reduce the risk in the future. There is also a case for more systematic evaluation of former players, to get a more reliable estimate of the risk, though the fact there’s nothing that can currently be done about it means that players and family members need to be involved in that decision.

Stat of the Week Competition: March 12 – 18 2016

Each week, we would like to invite readers of Stats Chat to submit nominations for our Stat of the Week competition and be in with the chance to win an iTunes voucher.

Here’s how it works:

  • Anyone may add a comment on this post to nominate their Stat of the Week candidate before midday Friday March 18 2016.
  • Statistics can be bad, exemplary or fascinating.
  • The statistic must be in the NZ media during the period of March 12 – 18 2016 inclusive.
  • Quote the statistic, when and where it was published and tell us why it should be our Stat of the Week.

Next Monday at midday we’ll announce the winner of this week’s Stat of the Week competition, and start a new one.

(more…)

March 11, 2016

Getting to see opinion poll uncertainty

Rock’n Poll has a lovely guide to sampling uncertainty in election polls, guiding you step by step to see how approximate the results would be in the best of all possible worlds. Highly recommended.

Of course, we’re not in the best of all possible worlds, and in addition to pure sampling uncertainty we have ‘house effects’ due to different methodology between polling firms and ‘design effects’ due to the way the surveys compensate for non-response.  And on top of that there are problems with the hypothetical question ‘if an election were held tomorrow’, and probably issues with people not wanting to be honest.

Even so, the basic sampling uncertainty gives a good guide to the error in opinion polls, and anything that makes it easier to understand is worth having.

poll-land

(via Harkanwal Singh)