March 28, 2016

Briefly

  • “Unlike other projects that map cities by sound, Chatty Maps isn’t measuring volume or ranking neighborhoods as noisy or quiet. Instead, it shows the city across a spectrum of different sounds—as well as the emotions we associate them with.” I’m not convinced, but it’s interesting to look at. (via @teh_aimee)
  • “World Cup fans not responsible for the Zika outbreak”. (Scientific American blog, open-access research paper)   I think ‘responsible’ is the wrong word, but in any case, looking at the genomes of Zika virus specimens suggests that the current virus has been circulating in the Americas since 2013 at least. Also, the three samples from microcephaly cases don’t share any relevant mutation, so the more-severe disease in the current outbreak probably isn’t due to a change in the virus.  You can do a lot with genetics.
  • “Can an algorithm be wrong?” from limn.it
  • “Exposing algorithms” from the Tow Center for Digital Journalism: a summary from a session at the National Institute for Computer-Assisted Reporting conference

Stat of the Week Competition: March 26 – April 1 2016

Each week, we would like to invite readers of Stats Chat to submit nominations for our Stat of the Week competition and be in with the chance to win an iTunes voucher.

Here’s how it works:

  • Anyone may add a comment on this post to nominate their Stat of the Week candidate before midday Friday April 1 2016.
  • Statistics can be bad, exemplary or fascinating.
  • The statistic must be in the NZ media during the period of March 26 – April 1 2016 inclusive.
  • Quote the statistic, when and where it was published and tell us why it should be our Stat of the Week.

Next Monday at midday we’ll announce the winner of this week’s Stat of the Week competition, and start a new one.

(more…)

March 24, 2016

The fleg

Two StatsChat relevant points to be made.

First, the opinion polls underestimated the ‘change’ vote — not disastrously, but enough that they likely won’t be putting this referendum at the top of their portfolios.  In the four polls for the second phase of the referendum after the first phase was over, the lowest support for the current flag (out of those expressing an opinion) was 62%. The result was 56.6%.  The data are consistent with support for the fern increasing over time, but I wouldn’t call the evidence compelling.

Second, the relationship with party vote. The Herald, as is their wont, have a nice interactive thingy up on the Insights blog giving results by electorate, but they don’t do party vote (yet — it’s only been an hour).  Here are scatterplots for the referendum vote and main(ish) party votes (the open circles are the Māori electorates, and I have ignored the Northland byelection). The data are from here and here.
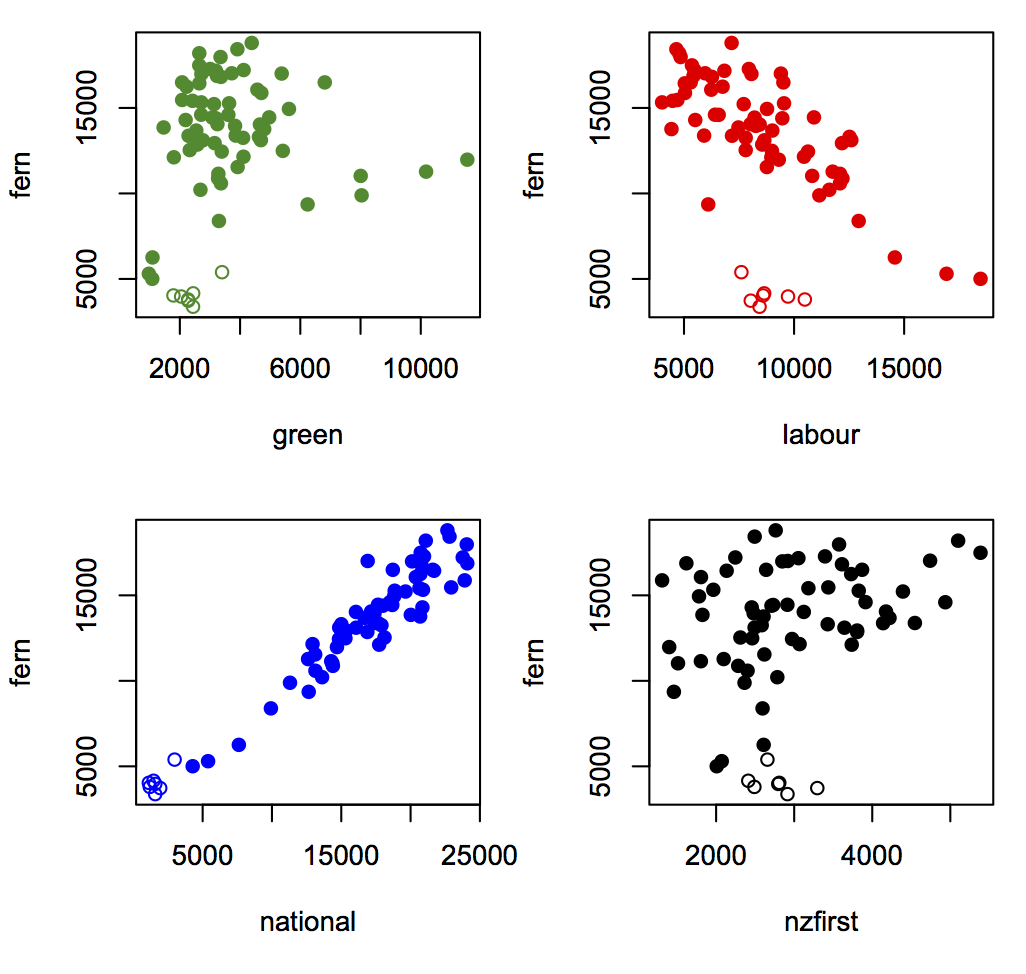
fleg

The strongest relationship is with National vote, whether because John Key’s endorsement swayed National voters or whether it did whatever the opposite of swayed is for anti-National voters.

Interestingly, given Winston Peters’s expressed views, electorates with higher NZ First vote and the same National vote were more likely to go for the fern.  This graph shows the fern vote vs NZ First vote for electorates divided into six groups based on their National vote. Those with low National vote are on the left; those with high National vote are on the right. (click to embiggen).
winston

There’s an increasing trend across panels because electorates with higher National vote were more fern-friendly. There’s also an increasing trend within each panel, because electorates with similar National vote but higher NZ First vote were more fern-friendly.  For people who care, yes, this is backed up by the regression models.


Two cheers for evidence-based policy

Daniel Davies has a post at the Long and Short and a follow-up post at Crooked Timber about the implications for evidence-based policy of non-replicability in science.

Two quotes:

 So the real ‘reproducibility crisis’ for evidence-based policy making would be: if you’re serious about basing policy on evidence, how much are you prepared to spend on research, and how long are you prepared to wait for the answers?

and

“We’ve got to do something“. Well, do we? And equally importantly, do we have to do something right now, rather than waiting quite a long time to get some reproducible evidence? I’ve written at length, several times, in the past, about the regrettable tendency of policymakers and their advisors to underestimate a number of costs; the physical deadweight cost of reorganisation, the stress placed on any organisation by radical change, and the option value of waiting. 

Graphics: what are they good for?

From Lucas Estevem, an interactive text-sentiment visualiser (click to embiggen, as usual)

sentiment

Andrew Gelman, whose class this was a project for, asks what the visualiser is useful for?

An interactive display is particularly valuable because we can try out different texts, or even alter the existing document word by word, in order to reverse-engineer the sentiment analyzer and see how it works. The sentiment analyzer is far from perfect, and being able to look inside in this way can give us insight into where it will be useful, where it might mislead, and how it might be improved.

Visualization. It’s not just about showing off. It’s a tool for discovering and learning about anomalies.

March 23, 2016

Super 18 Predictions for Round 5

Team Ratings for Round 5

The basic method is described on my Department home page.

Here are the team ratings prior to this week’s games, along with the ratings at the start of the season.

Current Rating Rating at Season Start Difference
Crusaders 8.94 9.84 -0.90
Highlanders 6.78 6.80 -0.00
Hurricanes 5.92 7.26 -1.30
Brumbies 5.46 3.15 2.30
Waratahs 3.87 4.88 -1.00
Chiefs 3.78 2.68 1.10
Stormers 1.56 -0.62 2.20
Sharks 0.11 -1.64 1.80
Lions -0.72 -1.80 1.10
Bulls -1.37 -0.74 -0.60
Blues -4.72 -5.51 0.80
Rebels -5.40 -6.33 0.90
Jaguares -8.77 -10.00 1.20
Force -9.23 -8.43 -0.80
Cheetahs -9.85 -9.27 -0.60
Reds -10.55 -9.81 -0.70
Sunwolves -12.36 -10.00 -2.40
Kings -16.67 -13.66 -3.00


Performance So Far

So far there have been 33 matches played, 19 of which were correctly predicted, a success rate of 57.6%.
Here are the predictions for last week’s games.

Game Date Score Prediction Correct
1 Hurricanes vs. Force Mar 18 41 – 6 17.00 TRUE
2 Waratahs vs. Highlanders Mar 18 26 – 30 1.80 FALSE
3 Bulls vs. Sharks Mar 18 16 – 16 2.30 FALSE
4 Sunwolves vs. Rebels Mar 19 9 – 35 0.20 FALSE
5 Crusaders vs. Kings Mar 19 57 – 24 29.10 TRUE
6 Reds vs. Blues Mar 19 25 – 25 -2.10 FALSE
7 Lions vs. Cheetahs Mar 19 39 – 22 12.00 TRUE
8 Stormers vs. Brumbies Mar 19 31 – 11 -2.60 FALSE
9 Jaguares vs. Chiefs Mar 19 26 – 30 -9.20 TRUE


Predictions for Round 5

Here are the predictions for Round 5. The prediction is my estimated expected points difference with a positive margin being a win to the home team, and a negative margin a win to the away team.

Game Date Winner Prediction
1 Hurricanes vs. Kings Mar 25 Hurricanes 26.60
2 Chiefs vs. Force Mar 26 Chiefs 17.00
3 Rebels vs. Highlanders Mar 26 Highlanders -8.20
4 Sunwolves vs. Bulls Mar 26 Bulls -7.00
5 Cheetahs vs. Brumbies Mar 26 Brumbies -11.30
6 Sharks vs. Crusaders Mar 26 Crusaders -4.80
7 Jaguares vs. Stormers Mar 26 Stormers -6.30
8 Reds vs. Waratahs Mar 27 Waratahs -10.90


NRL Predictions for Round 4

Team Ratings for Round 4

The basic method is described on my Department home page.

Here are the team ratings prior to this week’s games, along with the ratings at the start of the season.

Current Rating Rating at Season Start Difference
Cowboys 11.02 10.29 0.70
Broncos 8.71 9.81 -1.10
Roosters 5.20 11.20 -6.00
Storm 4.25 4.41 -0.20
Rabbitohs 3.63 -1.20 4.80
Bulldogs 1.40 1.50 -0.10
Sharks 0.55 -1.06 1.60
Raiders -0.35 -0.55 0.20
Dragons -1.06 -0.10 -1.00
Sea Eagles -1.48 0.36 -1.80
Eels -2.05 -4.62 2.60
Panthers -2.39 -3.06 0.70
Wests Tigers -3.99 -4.06 0.10
Titans -6.51 -8.39 1.90
Warriors -7.02 -7.47 0.40
Knights -8.24 -5.41 -2.80


Performance So Far

So far there have been 24 matches played, 14 of which were correctly predicted, a success rate of 58.3%.
Here are the predictions for last week’s games.

Game Date Score Prediction Correct
1 Cowboys vs. Roosters Mar 17 40 – 0 4.00 TRUE
2 Bulldogs vs. Eels Mar 18 6 – 20 9.70 FALSE
3 Knights vs. Raiders Mar 19 24 – 24 -5.80 FALSE
4 Panthers vs. Broncos Mar 19 23 – 22 -9.60 FALSE
5 Titans vs. Wests Tigers Mar 19 30 – 18 -1.40 FALSE
6 Warriors vs. Storm Mar 20 14 – 21 -7.30 TRUE
7 Dragons vs. Rabbitohs Mar 20 8 – 6 -2.40 FALSE
8 Sea Eagles vs. Sharks Mar 21 22 – 12 -0.50 FALSE


Predictions for Round 4

Here are the predictions for Round 4. The prediction is my estimated expected points difference with a positive margin being a win to the home team, and a negative margin a win to the away team.

Game Date Winner Prediction
1 Rabbitohs vs. Bulldogs Mar 25 Rabbitohs 5.20
2 Broncos vs. Cowboys Mar 25 Broncos 0.70
3 Raiders vs. Titans Mar 26 Raiders 9.20
4 Roosters vs. Sea Eagles Mar 26 Roosters 9.70
5 Dragons vs. Panthers Mar 27 Dragons 4.30
6 Warriors vs. Knights Mar 28 Warriors 5.20
7 Wests Tigers vs. Eels Mar 28 Wests Tigers 1.10
8 Sharks vs. Storm Mar 28 Storm -0.70


March 22, 2016

Counting sheep

From the Guardian (slightly outside our usual beat, but noted by Robin Evans on Twitter)

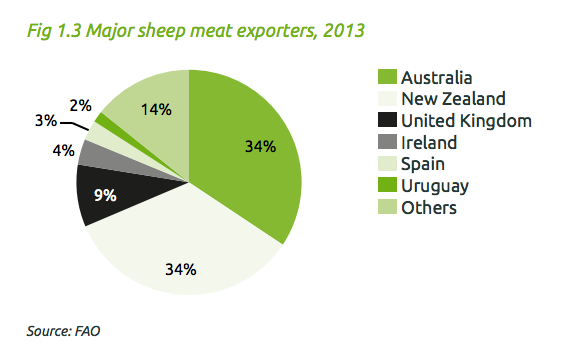
The UK is the world’s third largest lamb exporter – after Australia and New Zealand – with just over a third of the market.

That can’t be true. Even if Australia and New Zealand and the UK were the only exporters, the UK being in third place would mean it had to have less than a third of the market.  The (UK) Agriculture & Horticulture Development Board (PDF) thinks it’s about 9% — yes, that’s not just lamb, but lamb makes up most of the NZ and Oz exports.

sheep

I’m not sure what the ‘just over a third’ really is. It might be the proportion of UK-raised lamb that is exported.

It’s also interesting to see the Guardian slant on the story: that supermarkets should refuse to stock any imported lamb at this time of the year and insist on English lamb raised indoors, out of season.


March 21, 2016

Briefly

  • Many people have hypothesized, plausibly, that giving people risk estimates for disease based on genetics would encourage them to behave more healthily. The available evidence isn’t supportive.
  • Expensive but extremely effective hepatitis C drugs: an example of the sort of thing Pharmac might well want to fund ahead of Keytruda.

Stat of the Week Competition: March 19 – 25 2016

Each week, we would like to invite readers of Stats Chat to submit nominations for our Stat of the Week competition and be in with the chance to win an iTunes voucher.

Here’s how it works:

  • Anyone may add a comment on this post to nominate their Stat of the Week candidate before midday Friday March 25 2016.
  • Statistics can be bad, exemplary or fascinating.
  • The statistic must be in the NZ media during the period of March 19 – 25 2016 inclusive.
  • Quote the statistic, when and where it was published and tell us why it should be our Stat of the Week.

Next Monday at midday we’ll announce the winner of this week’s Stat of the Week competition, and start a new one.

(more…)