August 6, 2016

Momentum and bounce

Momentum is an actual property of physical objects, and explanations of flight, spin, and bounce in terms of momentum (and other factors) genuinely explain something.  Electoral poll proportions, on the other hand, can only have ‘momentum’ or ‘bounce’ as a metaphor — an explanation based on these doesn’t explain anything.

So, when US pollsters talk about convention bounce in polling results, what do they actually mean? The consensus facts are that polling results improve after a party’s convention and that this improvement tends to be temporary and to produce polling results with a larger error around the final outcome.

Andrew Gelman and David Rothschild have a long piece about this at Slate:

Recent research, however, suggests that swings in the polls can often be attributed not to changes in voter intention but in changing patterns of survey nonresponse: What seems like a big change in public opinion turns out to be little more than changes in the inclinations of Democrats and Republicans to respond to polls. 

As usual, my recommendation is the relatively boring 538 polls-plus forecast, which discounts the ‘convention bounce’ very strongly.

August 5, 2016

Briefly

  • Pollster.com is dropping (US) polls that only use landline phones.
  • From Brenda the Civil Disobedience Penguin, at the Guardian:  the West Island’s forthcoming Census is not making friends. This is bad. The census is important; trust in the census is important.
  • On a more positive not, the Guardian also has an database of dog names in Australia. Sadly, there aren’t any Rottweilers called “Fluffy”.

And, finally, a nice note on how to display agree-disagree data and similar:

Currie Cup Predictions for Round 1

Team Ratings for Round 1

The basic method is described on my Department home page.

Here are the team ratings prior to this week’s games, along with the ratings at the start of the season.

Current Rating Rating at Season Start Difference
Lions 9.69 9.69 -0.00
Western Province 6.46 6.46 0.00
Blue Bulls 1.80 1.80 0.00
Sharks -0.60 -0.60 0.00
Cheetahs -3.42 -3.42 -0.00
Pumas -8.62 -8.62 0.00
Cavaliers -10.00 -10.00 0.00
Griquas -12.45 -12.45 0.00
Kings -14.29 -14.29 -0.00


Predictions for Round 1

Here are the predictions for Round 1. The prediction is my estimated expected points difference with a positive margin being a win to the home team, and a negative margin a win to the away team.

Game Date Winner Prediction
1 Griquas vs. Kings Aug 05 Griquas 5.30
2 Blue Bulls vs. Western Province Aug 05 Western Province -1.20
3 Pumas vs. Sharks Aug 05 Sharks -4.50
4 Cavaliers vs. Cheetahs Aug 06 Cheetahs -3.10


August 4, 2016

Garbage numbers

This appeared on Twitter

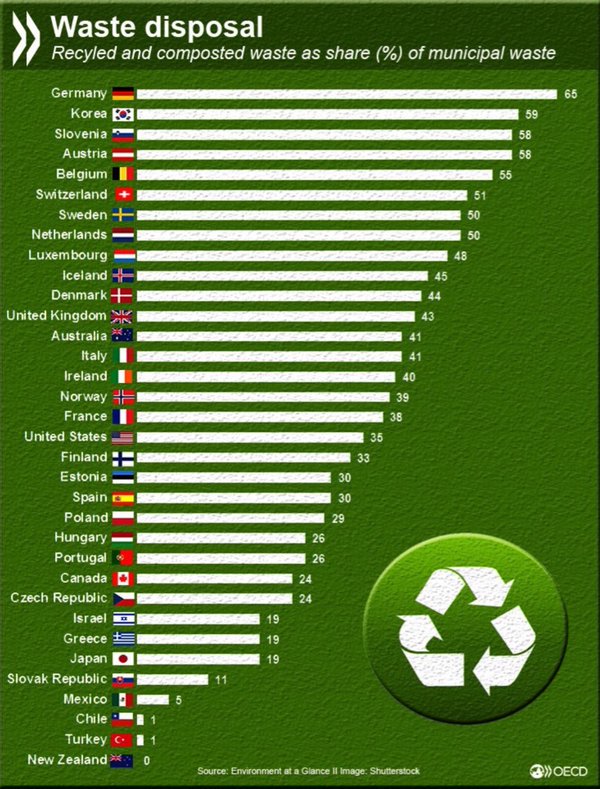
CcO-e4rWwAERzX5

Now, I could just about believe NZ was near the bottom of the OECD, but to accept zero recycling and composting is a big ask.  Even if some of the recycling ends up in landfill, surely not all of it does.  And the garden waste people don’t charge enough to be putting all my wisteria clippings into landfill.

So, I looked up the source (updated link). It says to see the Annex Notes. Here’s the note for New Zealand

New Zealand: Data refer to amount going to landfill

The data point for New Zealand is zero by definition — they aren’t counting any of the recycling and composting.

When the most you can hope for is that the lies in the graph will be explained in the footnotes, you need to read the footnotes.


August 3, 2016

Not a sausage

Q: Did you see the Sausages of DOOM are back?

A: In the Herald? Yes.

Q: They say “Swapping a sausage for whole grain toast, a few tomatoes or a handful of nuts could lead to a much longer life, research has shown.” How much longer?

A: The research goes to great lengths not to answer that question, but we could ignore all those the details and assume the number applies to that question and is reliable.

Q: Well,  the story does, so let’s do that.

A: Ok. A bit less than a hour.

Q: That’s not very long.

A: One sausage isn’t very much.

Q: But they mean one sausage less every day, surely.

A: In that case, a bit less than an hour per day.

Q: Where does that number come from?

A: If you look at the biggest risk you can find anywhere in the research report, it’s a hazard ratio of 1.34 for an additional 3% of your energy intake from meat protein. On average 3% in the US or here is about 75 Calories, so about 19g of protein.  That’s about two sausages (Freedom Farms has nutritional info easily available, others are probably similar).  So we’re looking at a hazard ratio of 1.16 per daily sausage.  One ‘microlife‘ per day is about a hazard ratio of 1.09.

Q: What’s that in cigarettes?

A: Two or three.

Q: Where did you find the research report? There’s a link in the story, but it just goes to the publisher’s home page.

A: It’s here. Open access, too.

Q: If I ask you about those details you mentioned ignoring, will I regret it?

A: Yes.

Q: I’m going to ask anyway.

A: Ok.  The research was trying to estimate the difference in risk from a replacement of animal protein with plant protein, making no change in fat, calories, carbohydrates, or anything else.

Q: So we’d have to replace the sausage with low-carbohydrate toast with a lot of margarine?

A: Butter. Saturated fat has to stay the same, too.

Q: But they found a huge difference between processed and unprocessed red meat! That’s the same protein, just chopped up, maybe with different amounts of fat and some preservatives. How could it be the protein that’s doing it?

A: Well, obviously it can’t. They must be picking up other things about diet as well.

Q: What do they say about that?

A: They say the other factors might affect how much effect animal protein has on you, but they couldn’t explain the overall effect

Q: But..

A: They also said that the risk difference between people with healthy and unhealthy lifestyles could maybe be explained by fish and chicken protein being less harmful than red meat protein

Q:  Really?

A: Those with unhealthy lifestyles consumed more processed and unprocessed red meat, whereas the healthy-lifestyle group consumed more fish and chicken as animal protein sources, suggesting that different protein sources, at least in part, contributed to the observed variation in the protein-mortality associations according to lifestyle factors

Q: Does that make more sense than it sounds as if it does?

A: I don’t think so.

Q: So sausages are actually healthy?

A: No, but they aren’t dramatically different from last week. And it’s probably not the composition of the protein that’s the biggest problem with them
Super 18 Predictions for the Super Rugby Final

Team Ratings for the Super Rugby Final

The basic method is described on my Department home page.

Here are the team ratings prior to this week’s games, along with the ratings at the start of the season.

Current Rating Rating at Season Start Difference
Hurricanes 11.84 7.26 4.60
Chiefs 8.82 2.68 6.10
Highlanders 8.27 6.80 1.50
Crusaders 8.25 9.84 -1.60
Lions 6.74 -1.80 8.50
Waratahs 5.12 4.88 0.20
Brumbies 2.91 3.15 -0.20
Stormers 0.12 -0.62 0.70
Sharks -0.91 -1.64 0.70
Bulls -1.13 -0.74 -0.40
Blues -2.11 -5.51 3.40
Jaguares -7.37 -10.00 2.60
Cheetahs -9.10 -9.27 0.20
Rebels -9.53 -6.33 -3.20
Force -10.81 -8.43 -2.40
Reds -11.74 -9.81 -1.90
Sunwolves -20.76 -10.00 -10.80
Kings -21.84 -13.66 -8.20


Performance So Far

So far there have been 141 matches played, 103 of which were correctly predicted, a success rate of 73%.
Here are the predictions for last week’s games.

Game Date Score Prediction Correct
1 Hurricanes vs. Chiefs Jul 30 25 – 9 5.20 TRUE
2 Lions vs. Highlanders Jul 30 42 – 30 1.20 TRUE


Predictions for the Super Rugby Final

Here are the predictions for the Super Rugby Final. The prediction is my estimated expected points difference with a positive margin being a win to the home team, and a negative margin a win to the away team.

Game Date Winner Prediction
1 Hurricanes vs. Lions Aug 06 Hurricanes 9.10


NRL Predictions for Round 22

Team Ratings for Round 22

The basic method is described on my Department home page.

Here are the team ratings prior to this week’s games, along with the ratings at the start of the season

Current Rating Rating at Season Start Difference
Storm 10.95 4.41 6.50
Cowboys 10.09 10.29 -0.20
Sharks 7.34 -1.06 8.40
Raiders 5.51 -0.55 6.10
Bulldogs 2.41 1.50 0.90
Broncos 1.49 9.81 -8.30
Sea Eagles 0.24 0.36 -0.10
Panthers 0.06 -3.06 3.10
Titans -0.34 -8.39 8.00
Roosters -0.67 11.20 -11.90
Warriors -1.67 -7.47 5.80
Eels -2.21 -4.62 2.40
Wests Tigers -2.28 -4.06 1.80
Dragons -5.68 -0.10 -5.60
Rabbitohs -8.47 -1.20 -7.30
Knights -15.11 -5.41 -9.70


Performance So Far

So far there have been 152 matches played, 95 of which were correctly predicted, a success rate of 62.5%.
Here are the predictions for last week’s games.

Game Date Score Prediction Correct
1 Roosters vs. Broncos Jul 28 32 – 16 -1.60 FALSE
2 Bulldogs vs. Dragons Jul 29 13 – 10 12.40 TRUE
3 Warriors vs. Panthers Jul 30 20 – 17 2.10 TRUE
4 Eels vs. Wests Tigers Jul 30 8 – 23 6.00 FALSE
5 Cowboys vs. Storm Jul 30 8 – 16 3.80 FALSE
6 Rabbitohs vs. Raiders Jul 31 4 – 54 -5.00 TRUE
7 Sea Eagles vs. Knights Jul 31 36 – 16 18.00 TRUE
8 Titans vs. Sharks Aug 01 18 – 18 -5.60 FALSE


Predictions for Round 22

Here are the predictions for Round 22. The prediction is my estimated expected points difference with a positive margin being a win to the home team, and a negative margin a win to the away team.

Game Date Winner Prediction
1 Dragons vs. Broncos Aug 04 Broncos -4.20
2 Eels vs. Sea Eagles Aug 05 Eels 0.60
3 Knights vs. Bulldogs Aug 06 Bulldogs -14.50
4 Sharks vs. Raiders Aug 06 Sharks 4.80
5 Storm vs. Rabbitohs Aug 06 Storm 22.40
6 Titans vs. Warriors Aug 07 Titans 5.30
7 Wests Tigers vs. Cowboys Aug 07 Cowboys -9.40
8 Panthers vs. Roosters Aug 08 Panthers 3.70


August 1, 2016

Stat of the Week Competition: July 30 – August 5 2016

Each week, we would like to invite readers of Stats Chat to submit nominations for our Stat of the Week competition and be in with the chance to win an iTunes voucher.

Here’s how it works:

  • Anyone may add a comment on this post to nominate their Stat of the Week candidate before midday Friday August 5 2016.
  • Statistics can be bad, exemplary or fascinating.
  • The statistic must be in the NZ media during the period of July 30 – August 5 2016 inclusive.
  • Quote the statistic, when and where it was published and tell us why it should be our Stat of the Week.

Next Monday at midday we’ll announce the winner of this week’s Stat of the Week competition, and start a new one.

(more…)

July 31, 2016

Lucifer, Harambe, and Agrabah

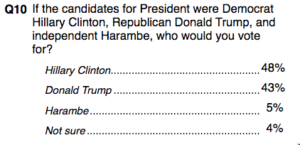
Public Policy Polling has a history of asking … unusual… questions in their political polls.  For example, asking if you are in favour of bombing Agrabah (the fictional country of Disney’s Aladdin), whether you think Hillary Clinton has ties to Lucifer, and whether you would vote for Harambe (the dead, 17-yr old gorilla) if running as an independent against Trump and Clinton.

From these three questions, the Lucifer one stands out: it comes from a familiar news issue and isn’t based on tricking the respondents. People may not answer honestly, but at least they know roughly what they are being asked and how it’s likely to be understood.  Since they know what they are being asked, it’s possible to interpret the responses in a reasonably straightforward way.

Now, it’s fairly common when asking people (especially teenagers) about drug use to include some non-existent drugs for an estimate of the false-positive response rate.  It’s still pretty clear how to interpret the results: if the name is chosen well, no respondents will have a good-faith belief that they have taken a drug with that name, but they also won’t be confident that it’s a ringer.  You’re not aiming to trick honest respondents; you’re aiming to detect those that aren’t answering honestly.

The Agrabah question is different. There had been extensive media discussion of the question of bombing various ISIS strongholds (eg Raqqa), and this was the only live political question about bombing in the Middle East. Given the context of a serious opinion poll, it would be easy to have a good-faith belief that ‘Agrabah’ was the name of one of these ISIS strongholds and thus to think you were being asked whether bombing ISIS there was a good idea. Because of this potential confusion, we can’t tell what the respondents actually meant — we can be sure they didn’t support bombing a fictional city, but we can’t tell to what extent they were recklessly supporting arbitrary Middle-Eastern bombing versus just being successfully trolled. Because we don’t know what respondents really meant, the results aren’t very useful.

The Harambe question is different again. Harambe is under the age limit for President, from the wrong species, and dead, so what could it even mean for him to be a candidate?  The charitable view might be that Harambe’s 5% should be subtracted from the 8-9% who say they will vote for real, living, human candidates other than Trump and Clinton. On the other hand, that interpretation relies on people not recognising Harambe’s name — on almost everyone not recognising the name, given that we’re talking about 5% of responses.  I can see the attraction of using a control question rather than a half-arsed correction based on historical trends. I just don’t believe the assumptions you’d need for it to work.

Overall, you don’t have to be very cynical to suspect the publicity angle might have some effect on their question choice.

Briefly

harambe
 Harambe, as you may recall, is ineligible because of age, vital status, and species.  (/ht @smurray38)

  • Nathan Yau at Flowing Data has an animation to illustrate what, say, a 60% chance of winning the US Presidential Election means — for people who don’t work with probabilities regularly, showing them as counts is helpful. Some statisticians would argue that the ‘repeated elections’ way of thinking about the probability is wrong, but that doesn’t affect its usefulness in conveying the number.
  • Update:  I wrote on how it was strange for an otherwise health 20-year-old law student to be the exemplar patient in a campaign to increase awareness about a disease primarily of the old. Stuff now has a story on who was pushing the publicity campaign.