August 15, 2016

New Zealand at the top of the (per-capita) table

On a medals-per-capita basis, New Zealand now ranks at the top of the table with two gold medals and six  silver at the Rio Olympics, Statistics NZ said today.

With eight medals overall at the half way stage at Rio, New Zealand is the highest performing country, with the equivalent of 1.77 medals for every one million people.

Slovenia is second on 1.45 medals for every one million people. Hungary and Denmark are third and fourth respectively, with Fiji coming in fifth based on its one gold for the men’s rugby sevens win.

Capture

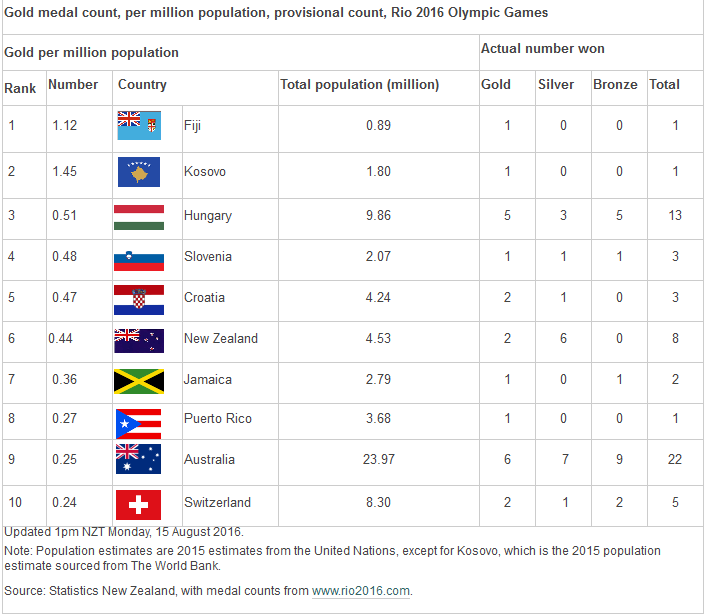
However, on a per-capita basis for gold medals alone, Fiji tops the table, with its one gold for a population of just under 900,000. On that basis, New Zealand’s two gold medals leave it in sixth place, with a population of more than 4.5 million.

During the weekend, Mahe Drysdale’s single sculls gold medal was the high point for the New Zealand team.

On Saturday, New Zealand won two silver medals, for shot-putter Valerie Adams and at the rowing where Genevieve Behrent and Rebecca Scown also picked up a medal in the pair.

See the SNZ data here: http://www.stats.govt.nz/browse_for_stats/population/estimates_and_projections/olympics-2016.aspx#tables

Graph of the week

From a real estate agent who will remain nameless

IMAG0280

Another example of the rule ‘if you have to write out all the numbers, the graph isn’t doing its work.”

Stat of the Week Competition: August 13 – 19 2016

Each week, we would like to invite readers of Stats Chat to submit nominations for our Stat of the Week competition and be in with the chance to win an iTunes voucher.

Here’s how it works:

  • Anyone may add a comment on this post to nominate their Stat of the Week candidate before midday Friday August 19 2016.
  • Statistics can be bad, exemplary or fascinating.
  • The statistic must be in the NZ media during the period of August 13 – 19 2016 inclusive.
  • Quote the statistic, when and where it was published and tell us why it should be our Stat of the Week.

Next Monday at midday we’ll announce the winner of this week’s Stat of the Week competition, and start a new one.

(more…)

August 11, 2016

Selective risk awareness

Disease risk awareness is one of the ways the media can help public health, and infections caused by waterborne organisms are one of the world’s leading public health problems. That’s not why this story is at the top  of  Stuff’s front page:

amoeba

If you click through, you find that she was in the US, that primary amoebic meningoencephalitis is extremely rare — with about three cases a year in the US — and that the last NZ case was during the Muldoon administration.

The children around the world who die every minute from more common water-borne infections mostly aren’t the right sort of children to make good clickbait in New Zealand.

BBC statistics reporting: two cheers

There’s just been a review of the handling of statistics by the BBC, from a review panel chaired by a former UK National Statistician, {Dame,Dr} Jil Matheson. The report was generally favourable, but made a set of recommendations that any organisation communicating or reporting statistics should think about:

The BBC should do much more to contextualise statistics so that audiences understand their significance, particularly when it comes to ‘big numbers’.  

The BBC should be better and braver in interpreting statistics for the audience to help them make sense of them.  The review found that audiences were “frustrated” with a tendency to simply present different sets of statistics from either side of an argument. 

The BBC should do more to go beyond the headlines and investigate figures underlying sources.  The Panel warned of the dangers of reporting statistics “straight from a press release.” 

More should be done to ensure that all BBC presenters are able to confidently challenge misleading/inaccurate statistical claims made by interviewees. 

The BBC should take a more consistent approach to presenting risk, such as in reporting of health-related statistics, although the report considers that the BBC generally performs better than other broadcasters. 

The BBC must be clear about significance in reporting statistics – there is a tendency to focus on change, but it is important to explain when a change is not in fact significant, such as in unemployment, GDP or inflation statistics. 

More can be done to increase the BBC’s statistical capacity, including how to better identify, use and develop in-house expertise and to ensure non-specialist journalists have access to statistical expertise. 

The BBC needs to develop and standardise its guidance for staff on reporting statistics, to ensure that it is applying standards consistently.

(ht @SciComGuy)

August 10, 2016

NRL Predictions for Round 23

Team Ratings for Round 23

The basic method is described on my Department home page.

Here are the team ratings prior to this week’s games, along with the ratings at the start of the season.

Current Rating Rating at Season Start Difference
Storm 9.48 4.41 5.10
Cowboys 8.62 10.29 -1.70
Raiders 6.95 -0.55 7.50
Sharks 5.91 -1.06 7.00
Bulldogs 2.37 1.50 0.90
Broncos 1.47 9.81 -8.30
Panthers 1.19 -3.06 4.20
Sea Eagles 0.20 0.36 -0.20
Warriors -0.60 -7.47 6.90
Wests Tigers -0.81 -4.06 3.20
Titans -1.41 -8.39 7.00
Roosters -1.80 11.20 -13.00
Eels -2.17 -4.62 2.50
Dragons -5.66 -0.10 -5.60
Rabbitohs -7.00 -1.20 -5.80
Knights -15.07 -5.41 -9.70


Performance So Far

So far there have been 160 matches played, 100 of which were correctly predicted, a success rate of 62.5%.
Here are the predictions for last week’s games.

Game Date Score Prediction Correct
1 Dragons vs. Broncos Aug 04 8 – 12 -4.20 TRUE
2 Eels vs. Sea Eagles Aug 05 10 – 9 0.60 TRUE
3 Knights vs. Bulldogs Aug 06 14 – 28 -14.50 TRUE
4 Sharks vs. Raiders Aug 06 14 – 30 4.80 FALSE
5 Storm vs. Rabbitohs Aug 06 15 – 14 22.40 TRUE
6 Titans vs. Warriors Aug 07 14 – 24 5.30 FALSE
7 Wests Tigers vs. Cowboys Aug 07 26 – 14 -9.40 FALSE
8 Panthers vs. Roosters Aug 08 38 – 18 3.70 TRUE


Predictions for Round 23

Here are the predictions for Round 23. The prediction is my estimated expected points difference with a positive margin being a win to the home team, and a negative margin a win to the away team.

Game Date Winner Prediction
1 Bulldogs vs. Sea Eagles Aug 11 Bulldogs 5.20
2 Broncos vs. Eels Aug 12 Broncos 6.60
3 Wests Tigers vs. Titans Aug 13 Wests Tigers 3.60
4 Warriors vs. Rabbitohs Aug 13 Warriors 10.40
5 Dragons vs. Sharks Aug 13 Sharks -8.60
6 Knights vs. Panthers Aug 14 Panthers -13.30
7 Roosters vs. Cowboys Aug 14 Cowboys -7.40
8 Raiders vs. Storm Aug 15 Raiders 0.50


Currie Cup Predictions for Round 2

Team Ratings for Round 2

The basic method is described on my Department home page.

Here are the team ratings prior to this week’s games, along with the ratings at the start of the season.

Current Rating Rating at Season Start Difference
Lions 9.69 9.69 -0.00
Western Province 5.35 6.46 -1.10
Blue Bulls 2.90 1.80 1.10
Sharks 0.10 -0.60 0.70
Cheetahs -2.11 -3.42 1.30
Pumas -9.33 -8.62 -0.70
Cavaliers -11.31 -10.00 -1.30
Griquas -12.45 -12.45 0.00
Kings -14.29 -14.29 -0.00


Performance So Far

So far there have been 3 matches played, 2 of which were correctly predicted, a success rate of 66.7%.
Here are the predictions for last week’s games.

Game Date Score Prediction Correct
1 Blue Bulls vs. Western Province Aug 05 45 – 26 -1.20 FALSE
2 Pumas vs. Sharks Aug 05 10 – 26 -4.50 TRUE
3 Cavaliers vs. Cheetahs Aug 06 16 – 44 -3.10 TRUE


Predictions for Round 2

Here are the predictions for Round 2. The prediction is my estimated expected points difference with a positive margin being a win to the home team, and a negative margin a win to the away team.

Game Date Winner Prediction
1 Lions vs. Pumas Aug 12 Lions 22.50
2 Sharks vs. Griquas Aug 12 Sharks 16.10
3 Kings vs. Cavaliers Aug 13 Kings 0.50
4 Cheetahs vs. Blue Bulls Aug 13 Blue Bulls -1.50


August 9, 2016

Briefly

  • The Australian Census. Comments from the Statistical Society of Australia (“The Statistical Society of Australia is concerned that these changes, brought in with the 2011 Census and repeated in 2016, and that have many potential benefits, have not been handled well”.) and Troy Hunt, a computer security person (“There are some good reasons to question the whole thing, plus some good reasons why it’s really a non-event” ).
  • False positives — Russell Brown writes about the ‘meth contamination’ panic from Housing NZ. “But a dwelling being rendered uninhabitable and needing to be torn apart simply because meth was consumed in it? It didn’t seem possible.
  • There has been a lot of discussion about the basic zoning in the Auckland Unitary Plan. Aaron Schiff has maps of the other stuff — the ‘overlays‘ that restrict development in other ways.
  • There’s a huge difference in style between @realDonaldTrump tweets posted on the iOS and Android Twitter clients. The obvious conclusion is that the Android tweets are real Donald himself, and the iPhone tweets are his staff.
  • An interesting survey measurement issue in estimating religious support for the presidential candidates — ‘evangelical Christian’ is a reasonably well-defined group, but there are big differences in how they are measured in surveys.
August 8, 2016

Stat of the Week Competition: August 6 – 12 2016

Each week, we would like to invite readers of Stats Chat to submit nominations for our Stat of the Week competition and be in with the chance to win an iTunes voucher.

Here’s how it works:

  • Anyone may add a comment on this post to nominate their Stat of the Week candidate before midday Friday August 12 2016.
  • Statistics can be bad, exemplary or fascinating.
  • The statistic must be in the NZ media during the period of August 6 – 12 2016 inclusive.
  • Quote the statistic, when and where it was published and tell us why it should be our Stat of the Week.

Next Monday at midday we’ll announce the winner of this week’s Stat of the Week competition, and start a new one.

(more…)

August 6, 2016

Not the news

Both the Herald and Stuff have a new story about men not being interested in dating intelligent women.  Stuff does slightly better by not having it on the web front page.

Now, this issue isn’t breaking news. Ask an intelligent woman, or if you’re unfortunate enough not to know any, consider the Glasses Gotta Go listing at TV Tropes. What does the story add to what we know from history, Hollywood, and everyday experience? Well, they have data. From 560 people. Who were all undergraduates. At Columbia University in New York. In speed-dating sessions.

It is difficult to understate the extent to which Columbia undergraduate speed-dating is representative of the romantic diversity of the human race.  So why would researchers from Poland do their research there? And while the experiment might be useful in comparing scientific theories of mate choice, why would it be news in New Zealand?

It’s news because a research paper just came out using the data — and presumably someone put out a press release. The paper is paywalled, but the original research report from 2014 is available.

If you look at the description of the data, one striking feature is that they come from a (highly recommended) 2007 statistics textbook (here they are). Andrew Gelman writes about the source of the data here. His link to the research where the data were collected (from 2002 to 2004) is dead, but another link is here. The original researchers were at Columbia, so for them Columbia undergraduates were a natural choice to study.

There’s nothing wrong with reanalysing the data, and Iyengar and Fisman are to be commended for making them available. And I suppose the line

As part of a new speed dating study, scientists from the Warsaw School of Economics, analysed the results from more than 4000 speed-dates.

isn’t actually untrue. But it sure is open to misinterpretation.

Anyway, while I’ve got the data, let’s us have a look. Here are graphs I drew for men’s and women’s decisions (similar to the ones in the report)

men-datingwomen-dating

The effect is there: the probability of a positive decision is highest when men rated intelligence as either 8 or 9, not as 10. But it’s weaker than I think the story suggests — what’s more dramatic is that men were unlikely to rate women as ’10’ in intelligence.

More importantly, if the correlation wasn’t there, we wouldn’t believe the data and it wouldn’t end up on the front page — this is news to confirm our beliefs, not to inform us.