November 11, 2016

A little history, for the Cubs

Ok, there has been more news since the Chicago Cubs won the World Series than you get in most years. But I still wanted to give some excerpts from what statisticians were writing the last time the Cubs won.

social

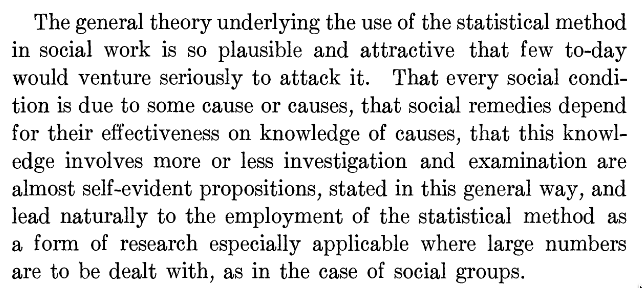
This is from “The Use and Misuse of Statistics in Social Work” by Kate Holladay Claghorn, in  Publications of the American Statistical Association Vol. 11, No. 82 (Jun., 1908), pp. 150-167.

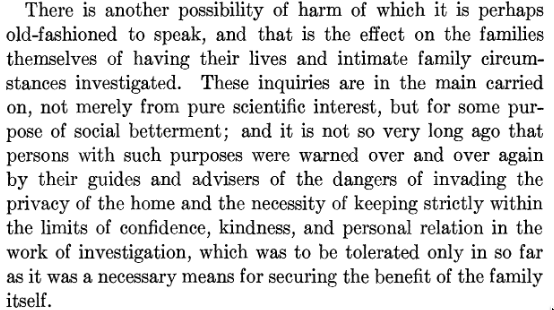
Her primary examples of ‘misuse’ are investigations carried out with inadequate sample sizes or measurement approaches and results presented in hard-to-understand ways, but she also writes about the harms of research

social2

I didn’t recognise her name, but I see from Wikipedia that Dr Claghorn was the first woman at Yale whose PhD was actually awarded at the commencement ceremony, and that she became one of the founders of the NAACP.


Briefly

  • Comparing the results of different geocoding (ie, address-looking-up) software (from Richard Law)
November 10, 2016

Understanding uncertainty

Predicting the US election result wasn’t a Big Data problem. There had only ever been 57 presidential elections and there’s good polling data for less than half of them. What it shares with a lot of Big Data problems is the difficulty of making sure you have thought about all the uncertainty, in particular when there’s a lot less information than it looks like there is, and the quality of that information is fairly low.

In particular, it’s a lot easier to get an accurate prediction of the mean opinion-poll result and a good estimate of its uncertainty than it is to translate that into uncertainty over number of states won.  It’s not hard to find out what your model thinks the uncertainty is; that’s just a matter of running the model over and over again in simulation. But simulation won’t tell you what sources of uncertainty you’ve left out.

For the US elections it turns out one thing that matters is the amount of correlation between states in the polling errors. Since there are 1225 correlations and maybe twenty elections worth of good polling data, the correlations aren’t going to be empirically determinable even if you assume there’s nothing special about this election– you need to make assumptions about how the variables you have relate to the ones you’re trying to predict.

The predictions from 538 still might not have been based on correct assumptions, but they were good enough for their conclusions to be basically right — and no-one else’s were, apparently even including the Trump campaign.

It’s not that we should give up on modelling. As we saw last time, sitting around listening to experts pull numbers out of the air works rather worse. But it’s important to understand the uncertainty in predictions can be a lot more than you’d get by asking the model — and the same is true, only much worse, when you’re modelling the effects of social or health interventions rather than just forecasting.


Who voted for Trump?

From Charles Stewart on Twitter via Brendan Nyhan: vote by county

swing

Republicans.

Yes, from a campaign-strategy and political-science point of view there are important small changes that (together with Electoral College bias) explain why Clinton lost and Obama won.  Yes, Clinton won noticeably fewer votes in small counties, and this matters.  But, to first order, the same people voted for Trump as for Romney.

(more detailed graphs here)

November 9, 2016

Election graphics highlights (and lowlights)

(To be updated as they turn up)

nyt

(Nominated by James Green in comments: 538’s ‘winding path’)

snake-803pm


Recommendations for sites to watch


First, ABC News exit poll doesn’t seem to understand bar charts

cwxvsd2xcaauow1

November 7, 2016

The Powerball jackpot: what are the odds

The chance of winning Powerball on a usual Lotto draw is fairly easy to calculate: you need pick 6 numbers correctly out of 40, and the powerball number correctly out of 10. The number of possible combinations is 3,838,380×10=38,383,800, so your chance is 1 in 38,383,800.  Buying 10 combinations twice a week, you’d get a perfect match a bit more than once every 37,000 years.

On Saturday, the prize was $38 million dollars. If tickets were $1 or less, the big prize would pay for buying all 38 million combinations — and the expected value of even smaller numbers of tickets would be more than they cost.  However, tickets cost $1.20 per “line” ($0.60 for the six numbers, $0.60 for the Powerball), so you’d  still lose money on average with each ticket you buy.

‘Must Win’ jackpots like the one on Wednesday are different.  The $40 million prize has to go, so the expected prize value per “line” is $40 million divided by the number of lines sold.  Unfortunately, we don’t know what that number is.  For the last ‘Must Win’ jackpot there were 2.7 million tickets sold, but we don’t know how many lines that represents; the most popular ticket has 10.

It looks like the expected value of tickets for this draw might be positive.  However ‘expected value’ is a technical term that’s a bit misleading in English: it’s the average (mean) of a lot of small losses and a few big wins.  Almost everyone who buys tickets for Wednesday’s draw will miss out on the big prize — the ‘averages’ don’t start averaging out until you buy millions of tickets. Still, your chances are probably better than in usual weeks.

Stat of the Week Competition: November 5 – 11 2016

Each week, we would like to invite readers of Stats Chat to submit nominations for our Stat of the Week competition and be in with the chance to win an iTunes voucher.

Here’s how it works:

  • Anyone may add a comment on this post to nominate their Stat of the Week candidate before midday Friday November 11 2016.
  • Statistics can be bad, exemplary or fascinating.
  • The statistic must be in the NZ media during the period of November 5 – 11 2016 inclusive.
  • Quote the statistic, when and where it was published and tell us why it should be our Stat of the Week.

Next Monday at midday we’ll announce the winner of this week’s Stat of the Week competition, and start a new one.

(more…)

November 5, 2016

Bad graph of the week

This one’s from the New England Journal of Medicine, who tweeted

nejm

If this graph conveyed any information, it would be saying the new trial of anti-retroviral treatment found no difference in neonatal HIV infection rates. Fortunately, the tweet is just clickbait, and if you click on the link (not the picture) and wait through a minute and a half of video, you get the real graph

nejm-2

You could also just read the abstract of the paper to get the information more quickly.

(via Julian Wolfson)

November 4, 2016

Unpublished clinical trials

We’ve known since at least the 1980s that there’s a problem with clinical trial results not being published. Tracking the non-publication rate is time-consuming, though.  There’s a new website out that tries to automate the process, and a paper that claims it’s fairly accurate, at least for the subset of trials registered at ClinicalTrials.gov.  It picks up most medical journals and also picks up results published directly at ClinicalTrials.gov — an alternative pathway for boring results such as dose equivalence studies for generics.

Here’s the overall summary for all trial organisers with more than 30 registered trials:

all

The overall results are pretty much what people have been claiming. The details might surprise you if you haven’t looked into the issue carefully. There’s a fairly pronounced difference between drug companies and academic institutions — the drug companies are better at publishing their trials.

For example, compare Merck to the Mayo Clinic
merck mayo

It’s not uniform, but the trend is pretty clear.


Fighting wrinkles

Q: So, lots of good health news today!

A: <suspiciously> Yes?

Q: Eating tomatoes prevents wrinkles and skin cancer! And it’s going to be tomato season soon.

A: Not convinced

Q: Why? Did the people have to eat too many tomatoes? Is that even possible?

A: No tomatoes were involved in the study. People took capsules of oil with tomato extract high in lycopene or lutein.

Q: Sounds a bit of a waste. But still, reducing wrinkles and sun damage generally must be good.

A: They didn’t measure wrinkles or skin cancer either.

Q: So what did they measure?

A: Activity of some genes related to skin damage by ultraviolet light.

Q: And these were significantly reduced, right?

A: Yes, but ‘significantly’ here just means ‘detectably’. It doesn’t necessarily translate into a lot of protection.

Q: Do they have an estimate of how much protection?

A: The Herald story says an earlier study found taking lycopene supplements to be as effective as an SPF 1.3 sunscreen.

Q: Only SPF 13? Still, if that’s just from the supplement it’s pretty impressive.

A: Not 13. SPF 1.3.

Q: Ok, so that’s not so impressive. But tomato season and sunscreen season peak at the same time, and every bit helps.

A: Actually, if it really is the lycopene, your horiatiki salad isn’t going to work — lycopene isn’t well absorbed from fresh tomatoes.