January 5, 2017

Traffic and the brain

Q: Do we need to move?

A: Um. No?

Q: “Living near a busy road could cause dementia”, it says.

A: No, that’s ok. We don’t live near a busy road, even to the extent that rhetorical constructs live anywhere.

Q: So what’s a ‘busy’ road, then?

A: An arterial or highway.  We’re more than 100m from the nearest one.

Q: That doesn’t sound very far.

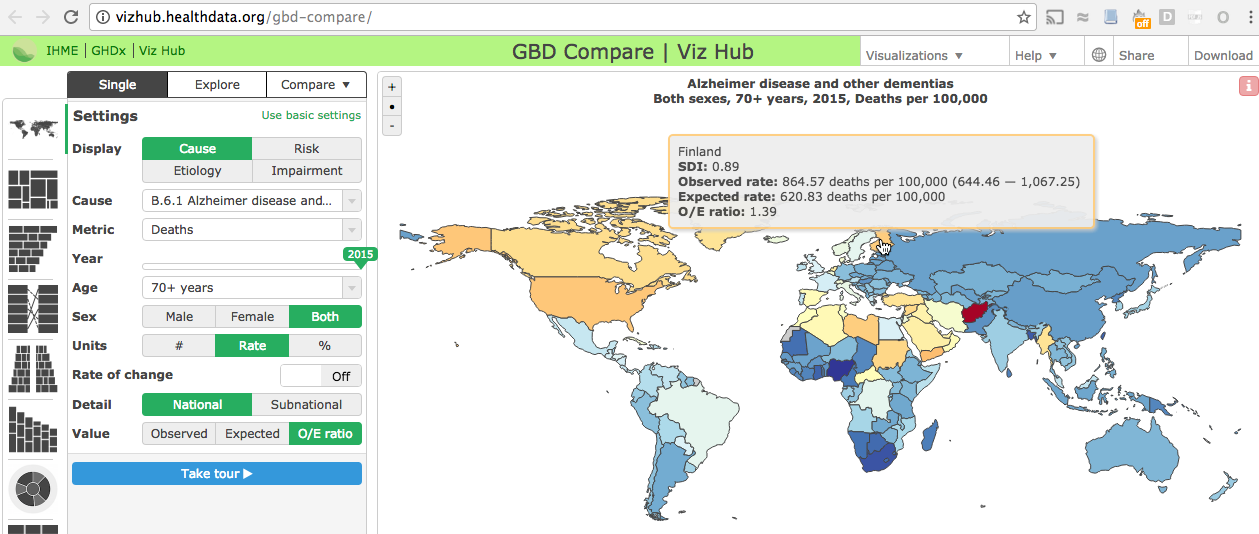
A: The 1.07 times higher risk estimated in the research paper is for people within 50m of a major road.

Q: How many people is that?

A: In Ontario (mostly Toronto), 20%.  In Auckland, not so many.

Q: But we’re supposed to be in favour of population density and cities, aren’t we?

A: Yes. But even if the effect is real, it’s pretty small.

Q: The story says roads are responsible for 1 in 9 cases. That’s not so small.

A: One in 9 cases among people who live within 50m of a major road. Or, using one of the other estimates from the research, one in 14 cases among people who live within 50m of a major road.

Q: And 150m from a major road?

A: About one in 50 cases.

Q: Ok, that’s pretty small. Can they really detect it?

A: They’ve got data on a quarter of a million cases of dementia, so it’s borderline.

Q: But still?

A: Well, the the statistical evidence isn’t all that strong. A p-value of 0.035 from one of the three neurological diseases they looked at, isn’t much in a data set that large.

Q: And it’s just a correlation, right?

A: They’ve been able to do a reasonable job of removing other factors, and the road proximity was measured a long time before the dementia, so at least they don’t have cause and effect backwards.  But, yes, it could be something they didn’t have good enough data or modelling for.

Q: How about age? That’s a big issue with modelling dementia, isn’t it?

A: These are epidemiologists — “physicians broken down by age and sex”, as the old joke says — they know about age. They only compared groups of people of exactly the same age.

Q: But what does ‘exactly the same age’ even mean for something that doesn’t have a precise starting time?

A: That’s more of a problem. If people living near major roads got dementia at the same rate, but had it diagnosed six months earlier on average, that would be enough to explain the difference. There’s no particular reason that should happen, but it’s not impossible.

Q: So is the research worth looking at?

A: Worth looking at for consenting scientists in private, but not really worth international publicity.


January 2, 2017

Stat of the Week Competition: December 31 2016 – January 6 2017

Each week, we would like to invite readers of Stats Chat to submit nominations for our Stat of the Week competition and be in with the chance to win an iTunes voucher.

Here’s how it works:

  • Anyone may add a comment on this post to nominate their Stat of the Week candidate before midday Friday January 6 2017.
  • Statistics can be bad, exemplary or fascinating.
  • The statistic must be in the NZ media during the period of December 31 2016 – January 6 2017 inclusive.
  • Quote the statistic, when and where it was published and tell us why it should be our Stat of the Week.

Next Monday at midday we’ll announce the winner of this week’s Stat of the Week competition, and start a new one.

(more…)

January 1, 2017

Kinds of fairness worth working for

Machine learning/statistical learning has a very strong tendency to encode existing biases, because it works by finding patterns in existing data.  The ability to find patterns is very strong, and simply leaving out a variable you don’t want used isn’t enough if there are ways to extract the same information from other data. Because computers look objective and impartial, it can be easier to just accept their decisions — or regulations or trade-secret agreements may make it impossible to find out what they were doing.

That’s not necessarily a fatal flaw. People learn from existing cases, too. People can substitute a range of subtler social signals for crude, explicit bigotry.  It’s hard to force people to be honest about how they made a decision — they may not even know. Computer programs have the advantage of being much easier to audit for bias given the right regulatory framework; people have the advantage of occasionally losing some of their biases spontaneously.

Audit of black-box algorithms can be done in two complementary ways. You can give them made-up examples to see if differences that shouldn’t matter do affect the result, and you can see if their predictions on real examples were right.  The second is harder: if you give a loan to John from Epsom but not to Hone from Ōtara, you can see if John paid on time, but not if Hone would have.  Still, it can be done either using historical data or by just approving some loans that the algorithm doesn’t like.  You then need to decide whether the results were fair. That’s where things get surprisingly difficult.

Here’s a picture from a Google interactivefairness

People are divided into orange and blue, with different distributions of credit scores. In this case the blue and orange people are equally likely on average to pay off a loan, but the credit score is more informative in orange people.  I’ve set the threshold so that the error rate of the prediction is the same in blue people as in orange people, which is obviously what you want. I could also have set the threshold so the proportion of approvals among people who would pay back the loan was the same in blue and orange people. That’s obviously what you want.  Or so the proportion of rejections among people who wouldn’t pay back the loan is the same. That, too, is obviously what you want.

You can’t have it all.

This isn’t one of the problems specific to social bias or computer algorithms or inaccurate credit scoring or evil and exploitative banks.  It’s a problem with any method of making decisions.  In fact, it’s a problem with any approach to comparing differences. You have to decide what summary of the difference you care about, because you can’t make them all the same.  This is old news in medical diagnostics, but appears not to have been considered in some other areas.

The motivation for my post was a post at Pro Publica on biases in automated sentencing decisions.  An earlier story had compared the specificity of the decisions according to race:  black people who didn’t end up reoffending were more likely to have been judged high risk than white people who didn’t end up reoffending. The company who makes the algorithm said, no, everything is fine because people who were judged high risk were equally likely to reoffend regardless of race. Both Pro Publica and the vendors are right on the maths; obviously they can’t both be right on the policy implications. We need to decide what we mean by a fair sentencing system. Personally, I’m not sure risk of reoffending should actually be a criterion, but if we stipulate that it is, there’s a decision to make.

In the new post, Julia Angwin and Jeff Larsen say

The findings were described in scholarly papers published or circulated over the past several months. Taken together, they represent the most far-reaching critique to date of the fairness of algorithms that seek to provide an objective measure of the likelihood a defendant will commit further crimes.

That’s true, but ‘algorithms’ and ‘objective’ don’t come into it. Any method of deciding who to release early has this problem, from judicial discretion in sentencing to parole boards to executive clemency. The only way around it is mandatory non-parole sentences, and even then you have to decide who gets charged with which crimes.

Fairness and transparency in machine learning are worth fighting for. They’re worth spending public money and political capital on. Part of the process must be deciding, with as much input from the affected groups as possible, what measures of fairness really matter to them. In the longer term, reducing the degree of disadvantage of, say, racial minorities should be the goal, and will automatically help with the decision problem. But a decision procedure that is ‘fair’ for disadvantaged groups both according to positive and negative predictive value and according to  specificity and sensitivity  isn’t worth fighting for, any more than a perpetual motion machine would be.

December 26, 2016

Stat of the Week Competition: December 24 – 30 2016

Each week, we would like to invite readers of Stats Chat to submit nominations for our Stat of the Week competition and be in with the chance to win an iTunes voucher.

Here’s how it works:

  • Anyone may add a comment on this post to nominate their Stat of the Week candidate before midday Friday December 30 2016.
  • Statistics can be bad, exemplary or fascinating.
  • The statistic must be in the NZ media during the period of December 24 – 30 2016 inclusive.
  • Quote the statistic, when and where it was published and tell us why it should be our Stat of the Week.

Next Monday at midday we’ll announce the winner of this week’s Stat of the Week competition, and start a new one.

(more…)

December 22, 2016

Mouthwash secrets: the embargo problem

On Tuesday, the Herald and some other media outlets, and the occasional journalist’s Twitter account published a story about mouthwash being able to prevent gonorrhea from spreading. Or, in some versions, cure it.  The research paper behind the story wasn’t linked and hadn’t been published. This time it seems to have been the newspapers’ fault: the stories appeared before the end of the news embargo.  The Herald story was pulled, then reappeared midday Wednesday with a link (yay)

Embargoes are an increasingly controversial topic in science journalism. The idea is that journalists get advance copies of a research paper and the press release, so they have time to look things up and ask for expert help or comment. There are organisations such as the NZ Science Media Centre to help with finding experts, or there’s your friendly neighbourhood university.

Sometimes, this works. Stories become more interesting and less slanted, or the journalist just decides the breakthrough wasn’t all that and the story is killed.  Without embargoes, allegedly, no-one would take the time to get it right. In medicine, too, there was the idea that doctors should be able to get the research paper by the time their patients saw the headlines.

On the other hand, embargoes feed into the idea that science stories are Breaking News that must be posted Right Now — that all published science is true (or important) for fifteen minutes. Ivan Oransky (who runs the Embargo Watch blog) argued recently at Vox that embargoes are no longer worthwhile; there’s also a rebuttal posted at Embargo Watch.

The Listerine/gonorrhea story, though, wasn’t new. Major outlets such as Teen Vogue and the BBC covered it in August(probably from a conference presentation). There are no details in the new Herald story that weren’t in the August stories.  It’s hard to see how anyone gains from the embargo here — except perhaps as a way of synchronising a wave of publicity.


December 21, 2016

Statistics: context and comparison

A story at Stuff today consists entirely of a graph from Figure.NZ

16917686

On one hand, it’s good to see this sort of data more widely circulated — that’s the point of Figure.NZ. On the other hand, it’s not clear what question the graph answers.

This distinction underlies two meaning of the word ‘statistics’.  Like Stats New Zealand, Figure.NZ provides a lot of statistics, collected and summarised information. This is a valuable public service, but the reason it’s valuable is that you can use the information to do statistics, to make comparisons and answer questions.

So, what comparisons should be most interesting for these numbers?  It’s probably not the raw totals — it would be surprising if Auckland didn’t get the majority biggest share of skilled migrants.  You might want to ask about skilled migrants as a fraction of the population, or as a fraction of the skilled labour force, or as a fraction of new members of the skilled labour force, or compared to previous years. You might be interested in regional GDP per skilled migrant, or regional council revenue for infrastructure.  You might want to compare the ratio of skilled and unskilled migrants in different regions.   But there’s almost always going to be a comparison involving another number.

Asking different questions about the numbers will lead to different stories; you don’t get a story without asking a question. The data don’t speak for themselves.

December 20, 2016

Briefly

  • “Algorithms can help stomp out fake news”, from the Atlantic.  They can, but if the algorithm is available to the public, you can just tweak your fake news until it passes. So there’s a moderately scary transparency tradeoff.
  • Donald Trump has managed the best Electoral College result by a white man since Bill Clinton. (data)
  • From NIWA: ocean currents around NZ

  • A lot of factoids on the internet are true, but only for very careful definitions of ‘true’, sometimes more than one in the same picture. (via @JulieB_92, @publicaddress)

Precision medicine?

  • Nicky Pellegrino, at Noted, “Genetic testing now offers personalised medicine, but just who should be tested?”
  • Nathaniel Comfort, in The Atlantic, “The Overhyping of Precision Medicine”
  • And again at Aeon, “Why the hype around medical genetics is a public enemy”

Lead and hope

The Flint water crisis is winding down: the city has been back on Detroit water for over a year, and in early December this year tests showed that nearly all the water supply was back within Federal standards for lead.  Criminal charges have been filed against some officials for their roles in creating or covering up the problems.

Flint residents were exposed to levels of lead in their drinking water that were well above the Federal safety threshold, and this translated, predictably, into higher levels of blood lead in children (and presumably in adults, too).  The proportion of kids under 5 with ‘elevated blood lead’, (>5μg/dL) increased from about 2% (close to the national average)  before the water crisis to about 4%.  Obviously, a national average of 2% means there are other places affected, but Flint was distinctive because the water-supply change was simple and deliberate.

On the other hand, lead is still one of the great victories over pollution. In the 2011-12 round of the US health survey NHANES, 95% of children had blood lead levels below 2.9 μg/dL.  In the 1976-1980 round(PDF), nearly 90% of  children had blood levels above 10 μg/dL, and 10% had levels above 30 μg/dL.  Abolishing lead in petrol has been a huge success and other restrictions have helped.  This year we’ve also seen signs that restricting CFCs has worked: the ozone hole may be slowly starting to heal.  Restricting CFCs was harder, and the improvement is slower, but we’re making progress.  It can work.


December 19, 2016

Sauna and dementia

Q: Did you see that saunas prevent dementia?

A: Well, even the Herald headline only says “could cut risk

Q: You don’t sound convinced.

A: No.

Q: Is this mice again?

A: No, I don’t think there are good animal models for saunas.

Q: Would it be inappropriate to attempt some sort of double entendre here?

A: Yes. The Finns would be offended.

Q: Ok. Back to business. You’re going to tell me that the research paper doesn’t make these claims and it’s all the fault of the British media, right?

A: No, the research paper has as one of its Key Points “Sauna bathing, an activity that promotes relaxation and well-being, may be a recommendable intervention to prevent or delay the development of memory diseases in healthy adults.”

Q: That’s pretty positive.

A: And the university press release is titled “Frequent sauna bathing protects men against dementia

Q: Is this one of those things that’s statistically significant but too small to care about?

A: No, they’re claiming a 2/3 reduction in dementia risk.

Q: Wow. That’s…umm…?

A: Larger than one would reasonably expect?

Q: Very diplomatically put.  Wait, so if that was true, you’d be able to see it in the national figures. Does Finland have a much lower dementia rate than you’d otherwise expect?

A: An excellent question.  No.

Q: [citation needed]

A: Well, ok, diagnosis bias makes it tricky, but the Institute for Health Metrics and Evaluation is making serious attempts to do international comparisons on all sorts of disease, and they think Finland has higher rates than expected, in contrast to the rest of Scandinaviasauna-alz

Q: So sauna isn’t protective?

A: Well, it’s not hugely, implausibly protective unless there’s some other Finland-specific risk factor that cancels it out