Posts filed under Surveys (188)

January 17, 2014

Hard-to-survey populations

As we saw a few weeks ago with the unexpectedly high frequency of virgin births, it can be hard to measure rare things accurately in surveys, because rare errors will crowd out the true reports. It’s worse with teenagers, as a new paper from the Add Health study has reported. The paper is not open-access, but there’s a story in MedicalXpress.

So imagine the surprise and confusion when subsequent revisits to the same research subjects found more than 70 percent of the self-reported adolescent nonheterosexuals had somehow gone “straight” as older teens and young adults.

“We should have known something was amiss,” says Savin-Williams. “One clue was that most of the kids who first claimed to have artificial limbs (in the physical-health assessment) miraculously regrew arms and legs when researchers came back to interview them.”

This wasn’t just data-entry error, and it probably wasn’t a real change; after some careful analysis they conclude it was a mixture of genuine misunderstanding of the question (“romantic” vs “sexual” attraction), and, well, teenagers. Since not many teens are gay (a few percent), it doesn’t take many incorrect answers to swamp the real data.

It doesn’t matter so much that the number of gay and bisexual teenagers was overestimated. The real impact is on the analysis of health and social development in this population.  In Add Health and at least one other youth survey, according to the researchers, this sort of error has probably led to overestimating the mental and physical health problems of non-heterosexual teenagers.
January 14, 2014

Health food research marketing

The Herald has a story about better ways to present nutritional information on foods

“Our study found that those who were presented with the walking label were most likely to make healthier consumption choices, regardless of their level of preventive health behaviour,” Ms Bouton said.

“Therefore, consumers who reported to be unhealthier were likely to modify their current negative behaviour and exercise, select a healthier alternative or avoid the unhealthy product entirely when told they would need to briskly walk for one hour and 41 minutes to burn off the product.

“The traffic light system was found to be effective in deterring consumers from unhealthy foods, while also encouraging them to consume healthy products.”

This sounds good. And this is a randomised experiment, which is an excellent feature.

However, it’s just an online survey of 591 people, about a hypothetical product, so what it actually found was that the labelling system was effective in deterring people from saying they would buy unhealthy foods, encouraging them to say they would consume healthy products and made them more likely to say they would exercise. That’s not quite so good. It’s a lot easier to get people to say they are going to eat better, exercise more, and lose weight that to get them to actually do it.

Another interesting feature is that this new research has appeared on the Herald website before. In October 2012 there was a story based on the first 220 survey responses

Not only were people more likely to exercise when they saw such labels, they also felt more guilty, Ms Bouton said.

“My findings showed that the exercise labelling was significantly more effective in both chocolate and healthier muesli bars in encouraging consumers to exercise after consumption.

“It increased the likelihood of having higher feelings of guilt after consumption and was more likely to stop [the participant] consuming the chocolate bar with the exercise labelling.”

The 2012 story still didn’t raise the issue of what people said versus actual behaviour, but it did get an independent opinion, who pointed out that calories aren’t the only purpose of food labelling.

More importantly, the stories and the two press releases are all the information I could find online about the research. There don’t seem to be any more details either published or in an online report. It’s good to have stories about scientific research, and this sort of experiment is an important step in thinking about food labelling, but the stories are presenting stronger conclusions that can really be supported by a single unpublished online survey.

December 20, 2013

Best? Worst? It’s all just numbers

From the Herald, based on a survey by a human resource company that’s lost its shift key

“New Zealand lags behind other Asia-Pacific countries in wage equality”

From the Ministry of Women’s Affairs, based on the Quarterly Employment Survey

New Zealand’s gender pay gap is the equal lowest in the OECD (along with Ireland). The gender pay gap at 10.1 percent (2013) is the lowest in the Asia-Pacific region.

It’s not that Herald personnel don’t know about the Government figures: about a month ago they ran a story describing the small but worrying increase in the governments estimate of the pay gap.

Now, it could be that both these things are true — perhaps they define the pay gap in different ways, or maybe the gap is much larger in some industries (and, necessarily, smaller in others).  But if you’re going to run a dramatically different estimate of such an important national statistic, it would be helpful to explain why it is different and how it was estimated, and say something about the implications of the difference.

Especially as once you find the company on the web (quite hard, since their name is “font”), you will also find they run an online salary survey website that provides self-reported salaries for a self-selected sample.  I hope that isn’t where the gender pay gap information is coming from.


December 19, 2013

Difficulties in interpreting rare responses in surveys

If some event is rare, then your survey sample won’t have many people who truly experienced it, so even a small rate of error or false reporting will overwhelm the true events, and can lead to estimates that are off by a lot more than the theoretical margin of sampling error.

The Herald has picked up on one of the other papers (open access, not linked) in this year’s Christmas BMJ, which looks at data from the National Longitudinal Study of Youth, in the US. This is an important social and health survey, and the paper is written completely seriously. Except for the topic

Of 7870 eligible women, 5340 reported a pregnancy, of whom 45 (0.8% of pregnant women) reported a virgin pregnancy (table 1). Perceived importance of religion was associated with virginity but not with virgin pregnancy. The prevalence of abstinence pledges was 15.5%. The virgins who reported pregnancies were more likely to have pledged chastity (30.5%) than the non-virgins who reported pregnancies (15.0%, P=0.01) or the other virgins (21.2%, P=0.007).

and

A third group of women (n=244) not included in analysis, “born again virgins,” reported a history of sexual intercourse early in the study but later provided a conflicting report indicating virginity. Reports of pregnancy among born again virgins were associated with greater knowledge of contraception methods with higher failure rates (withdrawal and rhythm methods) and lower interview quality (data not shown), and reports from this group may be subject to greater misclassification error.

The survey had carefully-designed and tested questions, and used computer-assisted interviewing to make participants more willing to answer potentially embarrassing questions. It’s about as good as you can get. But it’s not perfect.

December 15, 2013

He knows if you’ve been bad or good

From today’s Herald (or the very similar story at 3News)

A Wellness in the Workplace survey show sickies taken by people who aren’t really ill are estimated to account for 303,000 lost days of work each year, at a cost of $283 million.

Skipping over the estimate of over $900/day for the average cost of a sickie, this is definitely an example where a link to the survey report and some description of methodology might be helpful. The report says

The survey was conducted during the month of
June 2013. In total, 12 associations took part,
sending it out to a proportion of their members.
In addition, BusinessNZ sent the questionnaire
to a number of its Major Companies Group
members. Respondents were asked to report their
absence data for the 12-month period 1 January to
31 December 2012 and provide details of their policies
and practices for managing employee attendance.

In total, 119 responses were received from entities
across the private and public sectors.

which gives more idea about potential (un)representativeness. But most importantly,  while the survey has real data on numbers of absences and on policies, the information on how likely employees were to take sick leave when not sick was just the opinion of their employers. Unless you work for Santa or the NSA, this is going to have a large component of guesswork.

If you’re an employer, and you want to know whether inappropriate use of sick leave is a problem for your organisation, do you want to rely on your own guesses, or on an average of guesses by an anonymous assortment of 119 other organisations around the country?

December 6, 2013

If New Zealand were a village of 100 people ….

… according to the 2013 Census figures,

  • 51 would be female, 49 male.
  • 70 would be European, 14 Maori and 11 Asian.
  • 24 would have been born overseas
  • 21 would have a tertiary qualification
  • 4 would be unemployed.
  • 4 would earn over $100,000

Statistics New Zealand has done a nice graphic of the above, too. Full 2013 Census info available here.


November 12, 2013

This is your sampling on drugs

From Stuff, this morning

This year, and for the first time in New Zealand, Fairfax Media is partnering with the Global Drug Survey to help create the largest and most up-to-date snapshot of our drug and alcohol use, and to see how we compare to the rest of the world.

That all sounds good. The next line (with a link) is

Take the survey here.

That doesn’t sound so good.

This research group has been running a survey in partnership with UK clubbing magazine Mixmag for years, and last year branched out to ‘Global’ status with the help of the Guardian. Not all that global, though: more than half the respondents were from the UK, with half of the rest from the US.  As you might expect, the respondents were more likely to be from demographic groups with high drug use: overrepresented attributes included young, male, student, and gay or bi.   The research team and their expert advisory committee includes experts in a wide range of areas needed to design and interpret a study of this sort, with one exception: they don’t seem to have a statistician.

What are the results going to be useful for? Clearly, any estimates of prevalence of drug use will be pretty much useless if the survey oversamples drug users as it has in the past. Comparisons with past surveys done by different methods will be completely useless.  International comparisons within the survey will be a bit dodgy, since the newspapers taking part will reach different segments of each country– readers of the Fairfax media are quite a different subpopulation than Guardian readers

Useful information is more likely to be obtained on drug prices, on subjective experience of drug taking, on harm people experience from different drugs, and on comparison between drugs: eg, among people who’ve tried both MDMA and cocaine, which do they keep using and why?  In countries where there is no high-quality survey information, the semi-quantitative information about drug use might be helpful, but that’s probably not true for NZ or the USA.  Certainly for alcohol use, the NZ Health Survey would be more reliable, and the estimates of street price  of drugs from Massey’s IDMS should be pretty good.

For New Zealand, the most useful outcome would be if the survey provokes a repeat of the NZ Alcohol and Drug Use Survey, which was run in 2007-2008.

[Update: the NZ Health Survey was planned to have a drug use module in 2012. I can’t find any confirmation that it actually happened, or any planned release date for the data.  See the comments. The module was administered and data will appear next year. So, it’s definitely not true that there hasn’t been an NZ survey since 2007/8, contrary to the story]

November 8, 2013

Spending on foreign aid

It’s been a while since the last StatsChat bogus poll, so here’s a new one. Answer it before you read on

(more…)

November 4, 2013

Majorities in public and in politics

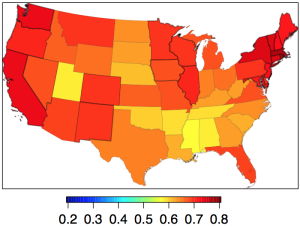
From Andrew Gelman, who is passing along research by some Columbia political scientists, the estimated support, by state, for the Employment Nondiscrimination Act, a gay rights bill that the US Senate will be voting on this Monday.

nondiscr


US Senators are elected by, and theoretically represent, their  state as a whole. The bill has majority support in every state, well over 60% in most states. It’s not clear whether it will pass.

Part of the problem is multilevel democracy: to be a Senator, you have to be selected as a candidate as well as winning the election. And the people who vote at the preselection stage (primary elections, in the US) average more extreme than those who vote in the election.  The more levels of selection you need, the worse the problem gets: Tim Gowers (prompted by the US government shutdown) does the mathematician thing and derives the extreme case. And the problem is exacerbated by the fact that politicians aren’t as knowledgeable about the views of their electorates as they think are.

November 1, 2013

Why we need self-driving cars

From Stuff

The [product being advertised] survey, which involved 2034 participants, found that 11 per cent of drivers admitted to having sex while driving. Men were three times more likely to admit to participating in sexual activity than women .

Firstly, a little skepticism would be appropriate here.  Isn’t it just possible there’s something wrong with the survey? If you go and search for the press release, you find

This online survey is not based on a probability sample and therefore no estimate of theoretical sampling error can be calculated.

which is not encouraging. Also, the breakdown by age in the press release says the proportion who have ‘participated in sexual activity’ while driving is even higher, 17%, among 18-44 year olds. And flirting with a driver in a different car is apparently less common than having it off with a passenger in the same car.

I suppose I could just have led a very sheltered life. But if these figures are accurate you’d expect the AA to have noticed and to have a slightly different list of the top ten driving distractions. And surely it would be hard to have missed the salacious headlines whenever one of these couples caused an accident, which 5% of them report having done.

I’m not sure if it’s encouraging or discouraging that this is a  Fairfax story, not something from the Daily Mail.