Posts filed under Surveys (188)

January 31, 2015

Big buts for factoid about lying

At StatsChat, we like big buts, and an easy way to find them is unsourced round numbers in news stories. From the Herald (reprinted from the Telegraph, last November)

But it’s surprising to see the stark figure that we lie, on average, 10 times a week.

It seems that this number comes from an online panel survey in the UK last year (Telegraph, Mail) — it wasn’t based on any sort of diary or other record-keeping, people were just asked to come up with a number. Nearly 10% of them said they had never lied in their entire lives; this wasn’t checked with their mothers.  A similar poll in 2009 came up with much higher numbers: 6/day for men, 3/day for women.

Another study, in the US, came up with an estimate of 11 lies per week: people were randomised to trying not to lie for ten weeks, and the 11/week figure was from the control group.  In this case people really were trying to keep track of how often they lied, but they were a quite non-representative group. The randomised comparison will be fair, but the actual frequency of lying won’t be generalisable.

The averages are almost certainly misleading, because there’s a lot of variation between people. So when the Telegraph says

The average Briton tells more than 10 lies a week,

or the Mail says

the average Briton tells more than ten lies every week,

they probably mean the average number of self-reported lies was more than 10/week, with the median being much lower. The typical person lies much less often than the average.

These figures are all based on self-reported remembered lies, and all broadly agree, but another study, also from the US, shows that things are more complicated

Participants were unaware that the session was being videotaped through a hidden camera. At the end of the session, participants were told they had been videotaped and consent was obtained to use the video-recordings for research.

The students were then asked to watch the video of themselves and identify any inaccuracies in what they had said during the conversation. They were encouraged to identify all lies, no matter how big or small.

The study… found that 60 percent of people lied at least once during a 10-minute conversation and told an average of two to three lies.


January 23, 2015

Meet Statistics summer scholar Bo Liu

Photo Bo LiuEvery year, the Department of Statistics offers summer scholarships to a number of students so they can work with staff on real-world projects. Bo, right, is working on a project called Construction of life-course variables for the New Zealand Longitudinal Census (NZLC) with Roy Lay-Yee, Senior Research Fellow at the COMPASS Research Centre, University of Auckland, and Professor Alan Lee of Statistics. Bo explains:

“The New Zealand Longitudinal Census has linked individuals across the 1981-2006 New Zealand censuses. This enables the assessment of life-course resources with various outcomes.

“I need to create life-course variables such as socio-economic status, health, education, work, family ties and cultural identity from the censuses. Sometimes such information is not given directly in the census questions, but several pieces of information need to be combined together.

“An example is the overcrowding index that measures the personal living space. We need to combine the age, partnership status of the residents and number of bedrooms in each dwelling to derive the index.

“Also, the format of the questionnaire as well as the answers used in each census were rather different, so data-cleaning is required. I need to harmonise information collected in each census so that they are consistent and can be compared over different censuses. For example, in one census the gender might be given code ‘0’ and ‘1’ representing female and male, but in another census the gender was given code ‘1’ and ‘2’. Thus the code ‘1’ can mean quite different things in different censuses. My job is to find these differences and gaps in each census.

“The results of this project will enable future studies based on New Zealand longitudinal censuses, say, for example, the influence of life-courses variables on the risk of mortality. This project will also be a very good experience for my future career, since data-cleaning is a very important process that we were barely taught in our courses but will actually cost almost one-third of the time in most real-life projects. When we were studying statistics courses, most data sets we encountered were “toy” data sets that had fewer variables and observations and were clean. However, in real life, as in this case, we often meet with data that have millions of observations, hundreds of variables, and inconsistent variable specification and coding.

“I hold a Bachelor of Commerce in Accounting, Finance and Information Systems. I have just completed Postgraduate Diploma in Science, majoring in Statistics, and in 2015, I will be doing Master of Science in Statistics.

“When I was studying information systems, my lecturer introduced several statistical techniques to us and I was fascinated by what statistics is capable of in the decision-making process. For example, retailers can find out if a customer is pregnant purely based on her purchasing behaviour, so the retailers can send out coupons to increase their sales. It is amazing how we can use statistical techniques to find that little tiny bit of useful information in oceans of data. Statistics appeals to me as it is highly useful and applicable in almost every industry.

“This summer, I will spend some time doing road trips – hopefully I can make it to the South Island this time. I enjoy doing road trips alone every summer as I feel this is the best way to get myself refreshed and motivated for the next year.”


January 21, 2015

How to feel good about New Zealand

StatsChat criticises the NZ media a lot, but if you really want a target-rich zone, the place is the UK. Today, the Daily Express had this front page:

B703j6kIcAEiyUl

The biggest vote on this country’s ties to ­Brussels for 40 years saw 80 per cent say they no longer want to be in Europe, the ­Daily Express can reveal.

It marks a huge leap forward in this news­paper’s crusade to get Britain out of the EU.


This comes from a survey in three Conservative electorates in the southern UK (out of 650 electorates), where 100,000 questionnaires were distributed. About 12% said Britain should leave the EUK, about 3% were opposed, and the other 85% didn’t respond.

Other, better-conducted polling doesn’t find such a dramatic lead. Even a late-December poll by “Get Britain Out” found only 51% support for leaving the EU and consoled themselves by describing this as showing their campaign was gaining momentum.

(via @federicacocco)

January 20, 2015

Ask a silly question, get a silly answer

The monthly US FoodDemand survey added some questions about government policies this time around. Mostly these were reasonable (eg, do you support a tax on sugared sodas, which got 39% ‘Yes”, the same as here; do you support a ban on sale of marijuana, 46% yes)

However, one question was

“Do you support mandatory labeling for foods containing DNA?”

There’s no way this is a sensible question about government policies: it isn’t a reasonable policy or one that has been under public debate.  Most foods will contain DNA, the exceptions being distilled spirits, some candy, and (if you don’t measure too carefully) white rice and white flour. Nevertheless, 80% of people were in favour.

There was also a question “Do you support mandatory labeling for foods produced with genetic engineering”. This got 82% support.

It seems most likely that many respondents interpreted these questions as basically the same: they wanted labelling for food containing DNA that was added or modified by genetic engineering.  This isn’t what the researchers meant, since they write

A large majority (82%) support mandatory labels on GMOs, but curiously about the same amount (80%) also support mandatory labels on foods containing DNA.

If you ask a question that is nuts when interpreted precisely, but is basically similar to a sensible question, people are going to answer the question they think you meant to ask. People are helpful that way, even when it isn’t helpful.

January 6, 2015

Foreign drivers, again

The Herald has a poll saying 61% of New Zealanders want to make large subsets of foreign drivers sit written and practical tests before they can drive here (33.9%: people from right-hand drive countries; 27.4% everyone but Australians). It’s hard to tell how much of this is just the push effect of being asked the questions and how much is real opinion.

The rationale is that foreign drivers are dangerous:

Overseas drivers were found at fault in 75 per cent of 538 injury crashes in which they were involved. But although failure to adjust to local conditions was blamed for seven fatal crashes, that was the suspected cause of just 26 per cent of the injury crashes.

This could do with some comparisons.  75% of 538 is 403, which is about 4.5% of all injury crashes that year.  We get about 2.7 million visitors per year, with a mean stay of 20 days (PDF), so on average the population is about 3.3% short-term visitors.

Or, we can look at the ‘factors involved’ for all the injury crashes. I get 15367  drivers of motorised vehicles involved in injury crashes, and 9192 of them have a contributing factor that is driver fault (causes 1xx to 4xx in the Crash Analysis System). This doesn’t include things like brake failures.  So, drivers on average are at fault in about 60% of the injury crashes they are involved in.

Based on this, it looks as though foreign drivers are somewhat more dangerous, but that restricting them is very unlikely to prevent more than, say, 1-2% of crashes. If you consider all the ways we might reduce injury crashes by 1-2%, and think about the side-effects of each one, I don’t think this is going to be near the top of the list.

January 2, 2015

Maybe not a representative sample

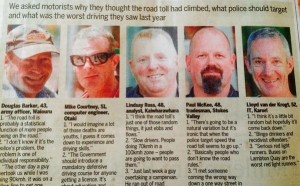
The Dominion Post asked motorists why they thought the road toll had climbed, and what should be done about it.

roadtoll

Interestingly, three of the five(middle-aged, white, male ,Wellington area) motorists attributed it to random variation. That’s actually possible: the evidence for a real change in risk nationally is pretty modest (and the Wellington region toll is down on last year).

(via @anderschri5 on Twitter)

December 29, 2014

What’s not in a name

I passed up this reprinted advertising-oriented survey story  about “The naughtiest names” the first time it came around. It’s back.

The findings come from a survey that looked at the names of more than 63,000 school children who logged good behaviour or achievement awards in online sticker books.

Those with the most good behaviour awards were named Jacob and Amy, closely followed by Georgia and Daniel.

Coincidentally, I’ve been listening to the BBC production of Good Omens, by Terry Pratchett and Neil Gaiman. It’s available online for the next three weeks. People who like that sort of  thing will find it’s the sort of thing they like. Early on, names are being suggested for a baby who turns out to be the Antichrist:

“Wormwood’s a nice name..Or Damien. Damien’s very popular….Or Cain. Very modern sound, Cain, really.”

This attempt to suggest ‘the naughtiest name’ failed dismally, and that’s probably true of the British survey as well.  The survey is probably a bit more representative of the population, but Good Omens is probably more realistic about the impact of names on the behaviour of children.

If you go to the original source, you see the originators of the survey didn’t really believe it either:

Neil Hodges, School Stickers Managing Director says, “The annual ‘Santa’s Naughty and Nice list’ is just a bit of fun, and obviously there are many Ella’s and Joseph’s that are perfect little angels, just as I’m sure there are many Amy’s and Jacobs that can be a bit of a handful.

though most of the mainstream media stories lost the disclaimer. This time it wasn’t the press release that was to blame.

It’s not that names have no effect. There’s a lot of research showing that identical job applications, for example, may be handled differently if different names are attached. There’s also a lot of social information in names — the story mentions research showing that you’re much more likely to get into Oxford or Cambridge if you’re called Eleanor than if you’re called Jade.

It’s possible there is some effect beyond social stratification and teacher prejudices, but this sort of survey is hopelessly unfit to reveal it.  That’s not the worst aspect, though. Even if the patterns of behaviour and name were real, they are soon going to be out of date. Patterns of first names change quite quickly, and this data presumably refers to kids who were named 5-10 years ago.  ‘Eleanor’ is now one of the names on the Naughty list.


December 22, 2014

How unrepresentative bogus polls can be

From @davejac on Twitter, clipped from Stuff

stuff-home


Since this is on the Census, we have good population data. If you include family-trust properties as ‘own’, which seems to be the intent, just over a quarter own mortgage-free, just under a third own but are paying a mortgage, and about a third are paying rent. The rest are more complicated.

The poll under-represents renters and over-represents owners, and it quite dramatically under-represents “Other”.

[update: those figures are for households, but the broad pattern of differences would be similar for people — there are more single-person households renting, but also large ones]

November 26, 2014

What doesn’t get into the papers

I complain a lot about the publicity-based surveys of varying quality that make it into the NZ media, but there’s a lot more that gets filtered out.

A journalist (who I’m not sure if I should name) sent me an example from Mitre 10

The research surveyed more than 1,500 New Zealanders on their connection to the quarter-acre dream and asked their opinions on the size of back yards and what they were doing to make the most of them.

An overwhelming 84 per cent of respondents agreed that they liked the idea of the traditional Kiwi quarter-acre paradise – a large plot of land with a standalone house on it, with plenty of room outdoors, and almost all said they would rather live on the traditional quarter-acre section than in high-density housing with reduced outdoor living spaces.

Over half of respondents felt that their outdoor living space is smaller now than what they had growing up (53%). Fifty percent of respondents attributed this to sections of land getting smaller, while 35 per cent believe houses are getting bigger, so there’s less room on a section for an outdoor living space.

The press release is a well-crafted example, with supporting evidence from QV that house sizes are increasing and quotes from a Massey University researcher — not about the survey, but about the general topic.

The survey, on the other hand, was fairly bogus. It was online, and most of the respondents got there through the Mitre 10 Facebook page.  You’d expect (and the Mitre 10 CEO has said) that the Facebook page attracts Mitre 10 customers, not necessarily a representative sample.  The report confirms this, with 88% of respondents being born in NZ, compared to about 75% of the population as a whole.

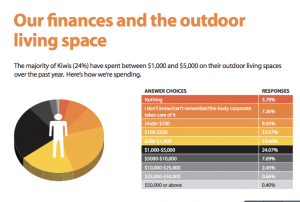
To make matters worse, here’s the reported data for the paragraphs quoted above. “Houses are bigger” and “sections are smaller” were alternative responses to the same question. You couldn’t answer that both were true — the correct answer, and the position that the report itself is pushing.

Untitled


One more finding I can’t resist quoting: “The majority of Kiwis (24%) have spent between $1,000 and $5,000 on their outdoor living spaces over the past year. “

Untitled 2

October 20, 2014

Advertising about your weekend

Today’s Daily Mail story in the Herald is unusual, not because it’s a survey done to advertise a company, but because the company of that name in New Zealand is getting a freebie. The story is describes people lying about their boring weekends, and it’s a survey commissioned by Travelodge, the UK budget hotel chain. The hotel company with with the Travelodge brand in this part of the world is, as far as I can tell, not related.

What is notable about the story, which confused me at first when looking across multiple versions in the British media, is that it’s a re-run. Travelodge did the same survey in 2011, on a larger sample. Here’s the Mail story from last time; the Herald escaped it then.

The press release for this year’s survey isn’t up, but if it’s like the 2011 one it won’t give any information about how the survey was conducted, and only reports a few highlights of the results, so if it were about anything important you wouldn’t want to pay attention.