Posts filed under Social Media (95)

November 17, 2012

Isn’t technology –ing wonderful?

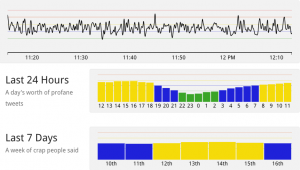
A new website WTFlevel.com (SFW, but makes siren noises) does real-time monitoring of the intensity of swearing on Twitter (only in English, unfortunately).

The record level so far was on US election day, where nearly 11% of tweets contained language unsuitable for those of a delicate constitution, most commonly in combination with the words “Romney” “Obama”, “election”, “stupid”, “white”, and “black”.

November 11, 2012

Point A to Point B

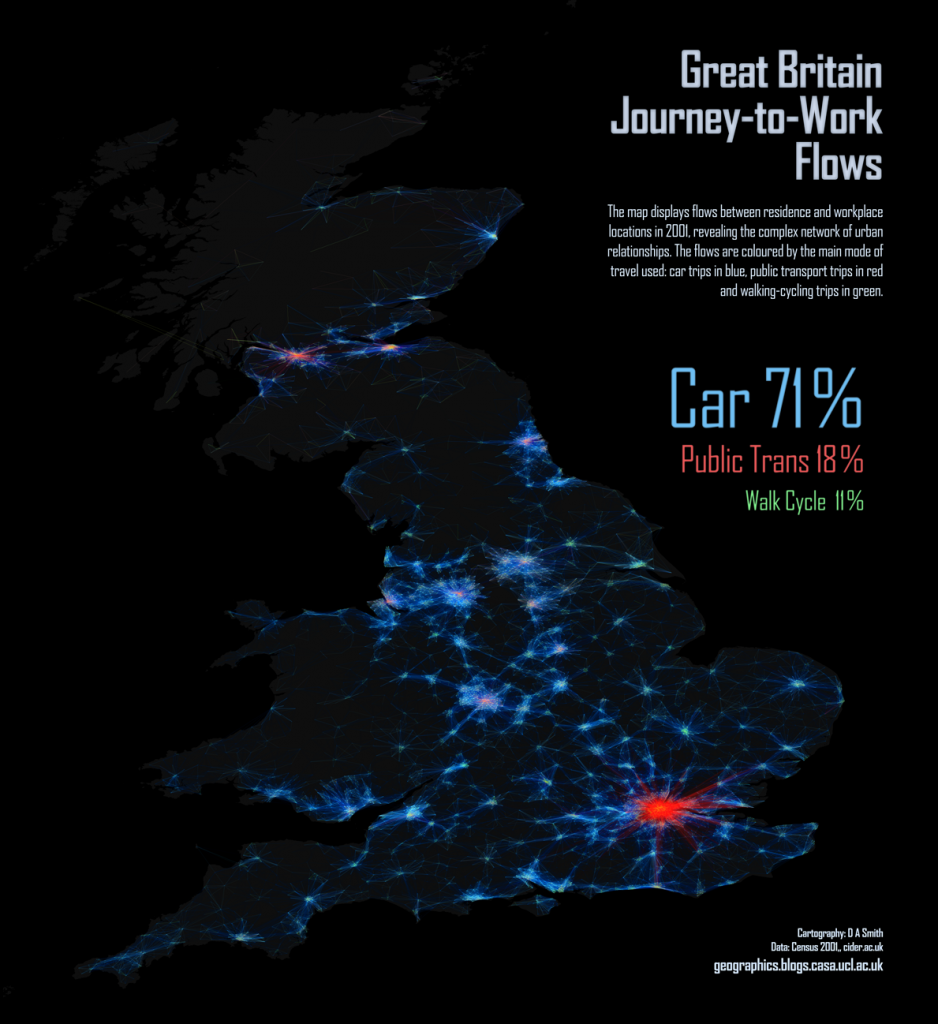
From the Mapping London blog, a picture of commuter flows in Great Britain. The difference in public transport use between London and the other cities is dramatic.  They have lots of other maps, including one of language use in London based on Twitter messages.  That would be interesting to do for NZ cities.

What do people tweet all day?

We saw the American Time Use Survey earlier this week, but a paper has just been published using a different source of publically-available time use data.

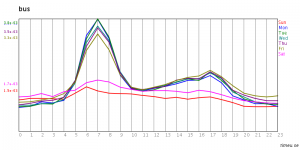
The site timeu.se collects information from Twitter and parses it to extract activities. For example: bus

On weekdays lots of people catch the bus in to work, and then teleport home. Or perhaps commuting home is just less tweet-worthy.

In any case, the data could be useful for picking up strong trends.  The new paper is about migraines, using time-of-day data from the website. The researchers found the expected differences between men and women, and between workdays and weekends/holidays, and the expected early morning peak, suggesting that tweet-mining at least isn’t completely bogus.

November 3, 2012

Nerdnite again

It’s Nerdnite time again, Tuesday night, 6:30pm, at Nectar (470 New North Rd, above the Kingslander).

The speakers this time:

  •  Cather Simpson, director of the Photon Factory, on lasers
  • Matthew Dentith, epistemologist, on conspiracy theories
  • Mike Dickison, giant flightless bird fancier, on why birds aren’t larger.

Incidentally, if you aren’t one of the 58273 people who have seen Mike Dickison’s hilarious presentation “Paedomorphic flightlessness and taxonomic affinities of an enormous Recent bird”, what are you waiting for?

November 25, 2011

Facebook data

Well worth a look is Facebook’s data page – they are building platforms to collect, manage and analyse data.

Their most recent update discusses why it appears your friends are more popular than you and the “6 degrees of separation” theory in light of Facebook data:

Using state-of-the-art algorithms developed at the Laboratory for Web Algorithmics of the Università degli Studi di Milano, we were able to approximate the number of hops between all pairs of individuals on Facebook. We found that six degrees actually overstates the number of links between typical pairs of users:

While 99.6% of all pairs of users are connected by paths with 5 degrees (6 hops), 92% are connected by only four degrees (5 hops). And as Facebook has grown over the years, representing an ever larger fraction of the global population, it has become steadily more connected. The average distance in 2008 was 5.28 hops, while now it is 4.74.