Posts filed under Silly (68)

April 13, 2012

A new StatsChat bogus poll


March 30, 2012

Lotto silliness

As my good friend and colleague Thomas Lumley points out we have plenty of Lotto-based silliness to tide us over until the next stupid health related press release from a conference with no quality checks. Case-in-point is the article Powerball could be in the stars in Thursday’s NZ Herald (29 March, 2012, A5): (also nominated by Sammie Jia for Stat of the Week).

The article reports the frequency of zodiac signs from a survey of 104 first division Lotto winners, and gleefully touts Taurus as the luckiest star sign with 13% of the total. The article gives us a summary table:

Taurus 13%
Libra 11%
Capricorn 10%
Aquarius 9%
Virgo 9%
Pisces 9%
Leo 8%


Of course, all keen Statschat readers will note that this table does not add up to 100%, nor does it show all twelve zodiac signs, which is not very helpful. Buried in the text is the additional information that Aries and Cancer combined make up 4% of the total.

If we spread the remaining probability over Gemini, Sagittarius and Scorpio, and make the not entirely justified assumption that the distribution of zodiac signs is uniform (which is exactly what the NZ Herald has done), then we can perform a simple chi-squared test of uniformity. This yields a P-value of 0.22, which for most frequentists isn’t exactly compelling evidence.

Being a Bayesian, I prefer to assume multinomial sampling with the prior on the probability of success being uniform. The figure below shows posterior credible intervals (based on 10,000 samples) for the true probability of success. The red dots are the observed values. The dashed line is the equal probability line (0.083 = 1/12).


All of the intervals overlap confirming our statistical intuition that all we are really observing is sampling variation. Yes, Ares and Cancer do fall below the line, but they are not significantly different from the other signs. You can, of course, not believe me – in which case Thomas has some tickets from last week’s draw going very cheap and your chance of winning is almost the same.

March 22, 2012

Bogus polls: a picture

From a talk I’m giving tomorrow to the Canterbury Mathematical Association:


“Bogus polls look a bit like real surveys on the outside, but don’t have any of the inner machinery that you need to make them work.”

February 22, 2012

More precision than strictly necessary?

Statisticians like precise information, but the new ICD10-CM codes for illness and injury perhaps go too far.

Suppose you’re out tramping in Otago and you get bitten by a kea, which flies off and then comes back for a second go.   These are

  • External causes of morbidity (codes V00-Y99)
  • subcategory: Exposure to animate mechanical forces (codes W50-W64)
  • subcategory:  Contact with birds (W61)
  • subcategory: W61.0 Contact with parrot
  • subcategory: W61.01Bitten by parrot

and the two bites have different codes: W61.01XA (initial encounter), and W61.01XD (subsequent encounter).  If it was a kakariki instead, the codes would be under W61.21(Bitten by other psittacines), but having a magpie dive into your head would just be the more general W61.92 (Struck by other birds).

[via: Ezra Klein]

February 12, 2012

More on telly viewing statistics ….

Media 7 last week featured our very own mistress of stats, Rachel Cunliffe, discussing why you can’t take a monthly cumulative audience and divide by four to get the weekly cumulative audience.

Media 7 host Russell Brown, in his latest Public Address column, looks at how a distinctly dodgy ‘statistic’ that came out of former broadcasting minister Jonathan Coleman’s office to justify Cabinet’s decision not to renew TVNZ 7’s funding was perpetuated through the media …   a must-read.

February 7, 2012

Superbowl statistics

American football games, like many sporting events, start with a coin toss, in this case to decide which team is playing in which direction.   At the last 14 Superbowls, the team from the National Football Conference has won the toss (via).  In a standard test of the hypothesis that the coin was fair, the p-value would be 0.0001.  So, does this mean the NFC is cheating? Well, no.  We have overwhelmingly good reasons to believe that coin tosses are very close to fair, and a mere 1 in 8000 coincidence shouldn’t change our minds.   As Tom Stoppard put it in  Rosencrantz and Guildensten Are Dead: “A spectacular vindication of the principle that each coin, spun individually, is just as likely to come up head as tails, and should cause no surprise each individual time it does.”

The generalization of this principle to studies purporting to find small, but statistically significant, benefits of homeopathy is left as an exercise to the reader.

January 5, 2012

Polling terminology

We’ve commented before on the annoying tendency of newspapers to claim that self-selected website polls actually mean something.  The media usually refers to the results as coming from “an unscientific poll”, but a better term would be “a bogus poll”.  In the interests of openness, democracy, and giving you something to do over summer, we are conducting a bogus poll ourselves, to find out which terminology is better.


December 24, 2011

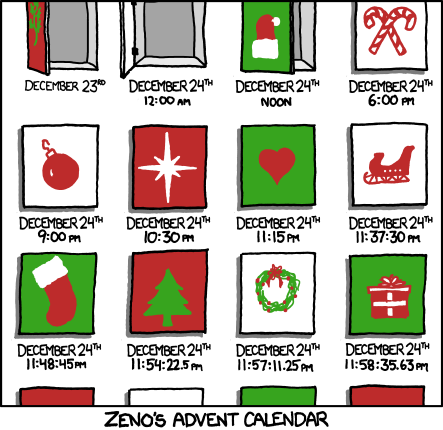
Zeno’s Advent Calendar

For mathematicians, philosophers, or those of you who left things a bit late….

[From XKCD, of course. PS: Confused?]