Posts filed under Silly (68)

May 16, 2014

Smarter than the average bear

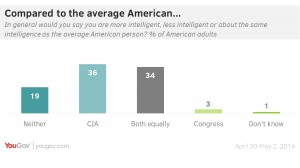
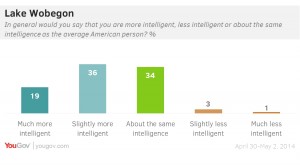
Online polling company YouGov asked people in the US and Britain about how their intelligence compared to other people.

For the US, the results were

usintel


They pulled that graph only seconds after I found it, and replaced it with the more plausible

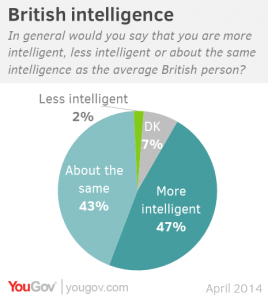
intelligence2

The British appear to be slightly more reluctant that the Americans to say they’re smarter than average, though it would be unwise to assume they are less likely to believe it.


selfassess1-2

March 16, 2014

The only way he knows how

Q: Did you see the story about aphrodisiacs on Stuff this weekend?

A: Yes

Q: How did they find out which ones worked?

A: It says “Richard Cornish investigates the only way he knows how.”

Q: Randomised n-of-1 trials with independent evaluation by someone who doesn’t know what he’s eaten?

A: Sadly, no.

Q: Allocating different foods, and some control foods, to a large group of people and collecting their reports?

A: No

Q: Getting a librarian to help him review the scientific research on the topic? Or the traditional knowledge?

A: Not really, though there are some biochemical or historical anecdotes for many of the items.

Q: Um. Did he just try each food as you would if you wanted to use it as an aphrodisiac?

A: Not that, either.

Q: I give up. What did he do?

A: ” It was my task to consume them in a bland environment, with no chance of any stimulation or excitement.”

Q: What a waste. But aren’t you being a bit harsh?  He’s a food writer and TV producer. He does sustainability and Spanish food. He’s not a science journalist or an investigative reporter.  They didn’t expect anyone to take it seriously.

A: Ok, but some of the nutrition stories and sex stories they run are supposed to be taken seriously. It should be easier to tell which is which online.

Q: Wait, isn’t it March now?

A: Yes.

Q: That sounds more like a Valentine’s Day column

A: An interesting point. You thought of that faster than I did.

Q: Well?

A: It is a Valentine’s Day column. From the Southland Times. Except they took out the foie gras and truffles to make it suitable for the national audience. Reruns aren’t just for The Simpsons, you know.
January 9, 2014

Infographic of the week

Via @keith_ng, this masterpiece showing that more searches for help lead to more language. Or something.

badlang

It’s not, sadly, unusual to see numbers being used just for ordering, but in this case the numbers don’t even agree with the vertical ordering.  And several of them aren’t, actually, languages. And the headline is just bogus.

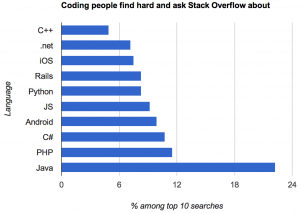
This version, by Kevin Marks (@kevinmarks), at least is accurate and readable.

oklang

but it’s hard to tell how much of Java’s dominance is due to it being popular versus being confusing.

Adam Bard has data on the most popular languages on the huge open-source software repository GitHub. This isn’t quite the right denominator, since Stack Overflow users aren’t quite the same population as GitHub users, but it’s something.  Assigning iOS, Android, and Rails, to Objective-C, Java, and Ruby respectively, and scaling by GitHub popularity, we find that C# has the most StackOverflow queries per GitHub commit; Objective-C and Java have about two-thirds as many.  In the end, though, this data isn’t going to tell you much about either high-demand programming skills or the relative friendliness of different programming languages.


December 29, 2013

Brute force and ignorance

My grandfather, a high school maths teacher, characterised a mathematician as someone who would rather spend an hour working out the quick way to solve a problem than fifteen minutes doing it the slow way.

Computers are so fast nowadays that many traditional ‘recreational maths’ problems can be solved by some brute-force approach. Christian Robert translates an example from Le Monde,

A regular die takes the values 4, 8 and 2 on three adjacent faces. Summit values are defined by the product of the three connected faces, e.g., 64 for the above. What values do the three other faces take if the sum of the eight summit values is 1768? 

and provides R code that just tries lots of possibilities. On my laptop, the code runs in about a quarter of a second.

More practically, the same applies to a lot of calculations in statistics –for example, if you need to work out what sample size is needed for an experiment, it’s often easier to simulate the experiment at different sizes and see what happens than to work out the solution mathematically.

There’s a similar problem for quizzes that are often made trivial by Google. Often, but not always. The famous Christmas quiz from King William’s College, on the Isle of Man is made easier by search engines, but still takes effort. For example, the first question:

In the year 1913: what famous club was founded at Vrijstraat 20?

You won’t get the answer just by Googling “Vrijstaat 20”, at least not yet (eventually Google will pick up on it), but with a bit of extra effort you can determine it must be PSV Eindhoven (select the white text, if you want the answer).

December 26, 2013

On the feast of Stephen

A 2003 card from UK satirical magazine Private Eye that seems perfect for StatsChat

yonder-pedant


and, yes, today, 26 December is St Stephen’s day.

(via @david_colquhoun)

December 18, 2013

Survival analysis of chocolate in hospital

You may remember StatsChat’s criticism of data quality and analysis in paper about chocolate and Nobel Prizes from a leading medical journal.  Another leading medical journal, BMJ, traditionally has a Christmas issue with not entirely serious papers, typically based on good-quality silly research. One of the past highlights was the systematic review of randomised trials of parachute use.

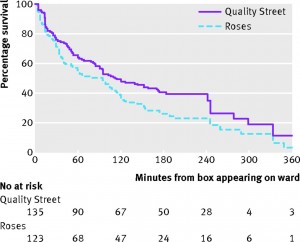
This year, there’s a survival analysis of chocolate in hospital wards. Survival analysis is the branch of statistics working with the time until an event happens.  Often the event is death, hence the name ‘survival’, but it could be something else bad, such as a heart attack, or something good, such as finding a job.  If you’re a chocolate, it’s being eaten.

survival


The data are a good fit to a constant hazard of consumption, with a rate of just under 1%/minute.  There isn’t any sign of strong heterogeneity — if some chocolates are preferred to others, the preference is either not strong enough or variable enough between people that no chocolates are safe.

Other papers in the Christmas issue include a semi-serious comparison of stem cell size and structure for mice and whales, and the finding that, in Dublin, people called Brady are more likely to have pacemaker treatment for bradycardia (presumably a multiple comparison issue)

December 9, 2013

Muphry’s Law

Muphry’s Law says that any attempt to criticise editing or proofreading will contain editing or proofreading errors. It clearly extends to criticising educational standards:

The biggest fall in NZ’s rankings was in mathematics, from 13th to 23rd (though we also fell from 7th to 18th in science and from seventh to 13th in reading).

(via @economissive)

November 25, 2013

–ing Twitter map

Showing what can be done straightforwardly with online data, the site Fbomb.co (possibly NSFW) is a live map of tweets containing what the Broadcasting Standards Authority tells us is the 8th most unacceptable word for NZ.  Surprisingly, it was written by a Canadian.

fbomb


“Millions of Kiwis are bombarding blacklisted child-sex-abuse sites”

Spotted this when reading Stuff’s homepage on my phone over the weekend:

stuff-screenshot

This is an obvious case where rewording a statistic makes it incorrect. When you read the full article, it’s a lot clearer:

“The Department of Internal Affairs has already blocked 34 million attempts within New Zealand to access at least one of 582 child sex abuse sites blocked by government filters since 2010.

And the number is rising, with roughly a million requests a month within New Zealand being blocked in the first half of this year.

However, while the stream of blocked requests was huge, the actual number of people consuming child sex abuse material in New Zealand was small and most of them were being caught, he said.”

According to Statistics New Zealand, 2.8 million New Zealanders were connected to the internet in 2012.

Update: David Farrar and Whale Oil blogged about this too and the headline has since been changed.

November 24, 2013

Measuring the right variable

superbowl


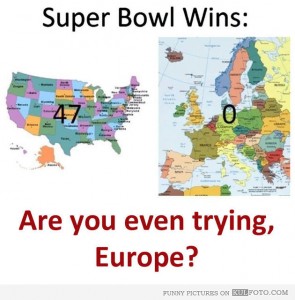
And, of course, New Zealand won the Rugby world cup, NZ or Australia will win the League world cup next weekend, and NZ was the only undefeated team in the last soccer World Cup, so Europe’s overall football credentials seem to be on shaky ground.  At least if you set up the comparison very, very carefully.

Generalisations of this approach to unsupported nutritional advertisting, surrogate outcomes in clinical trials, ranking of universities, and the claim that people with incomes below $110,000 collective pay no net income tax provide a lot of the work  for StatsChat.

(via Ben Atkinson on Twitter. I can’t identify the original source, but this version has the best punctuation.)