Posts filed under Significance (18)

March 14, 2016

Dementia and rugby

Dylan Cleaver has a feature story in the Herald on the Taranaki rugby team who won the Ranfurly Shield in 1964. Five of the 22 have been diagnosed with dementia. Early on in the process he asked me to comment on how surprising that was.

The key fact here is 1964: the five developed dementia fairly young, in their 60s and early 70s. That happens even in people who have no family history and no occupational risks, as I know personally, but it’s unusual.

I couldn’t find NZ data, but I did find a Dutch study (PDF, Table 3) estimating that a man who is alive and healthy at 55 has a 1.5% risk of diagnosed dementia by 70 and 3.2% by 75. There’s broadly similar data from the Framingham study in the US.   The chance of getting 5 or more out of 22 depends on exact ages and on how many died earlier of other causes, but if these were just 22 men chosen at random the chance would be less than 1 in 10,000 — probably much less.  People who know about rugby tell me the fact they were all in the back line is also relevant, and that makes the chance much smaller.

There are still at least two explanations. The first, obviously, is that rugby — at least as played in those days — caused similar cumulative brain damage to that seen in American football players. The second, though, is that we’re hearing about the 1964 Taranaki team partly because of the dementia cases — there wouldn’t have been this story if there had only been two cases, and there might have been a story about some other team instead. That is, it could be a combination of a tragic fluke and the natural human tendency to see patterns.  Statistics is bad at disentangling these; the issue crops up over and over again in cancer surveillance.

In the light of what has been seen in the US, I’d say it’s plausible that concussions contributed to the Taranaki cases.  There have already been changes to the game to reduce repeated concussions, which should reduce the risk in the future. There is also a case for more systematic evaluation of former players, to get a more reliable estimate of the risk, though the fact there’s nothing that can currently be done about it means that players and family members need to be involved in that decision.

February 13, 2016

Just one more…

NPR’s Planet Money ran an interesting podcast in mid-January of this year. I recommend you take the time to listen to it.

The show discussed the idea that there are problems in the way that we do science — in this case that our continual reliance on hypothesis testing (or statistical significance) is leading to many scientifically spurious results. As a Bayesian, that comes as no surprise. One section of the show, however, piqued my pedagogical curiosity:

STEVE LINDSAY: OK. Let’s start now. We test 20 people and say, well, it’s not quite significant, but it’s looking promising. Let’s test another 12 people. And the notion was, of course, you’re just moving towards truth. You test more people. You’re moving towards truth. But in fact – and I just didn’t really understand this properly – if you do that, you increase the likelihood that you will get a, quote, “significant effect” by chance alone.

KESTENBAUM: There are lots of ways you can trick yourself like this, just subtle ways you change the rules in the middle of an experiment.

You can think about situations like this in terms of coin tossing. If we conduct a single experiment where there are only two possible outcomes, let us say “success” and “failure”, and if there is genuinely nothing affecting the outcomes, then any “success” we observe will be due to random chance alone. If we have a hypothetical fair coin — I say hypothetical because physical processes can make coin tossing anything but fair — we say the probability of a head coming up on a coin toss is equal to the probability of a tail coming up and therefore must be 1/2 = 0.5. The podcast describes the following experiment:

KESTENBAUM: In one experiment, he says, people were told to stare at this computer screen, and they were told that an image was going to appear on either the right site or the left side. And they were asked to guess which side. Like, look into the future. Which side do you think the image is going to appear on?

If we do not believe in the ability of people to predict the future, then we think the experimental subjects should have an equal chance of getting the right answer or the wrong answer.

The binomial distribution allows us to answer questions about multiple trials. For example, “If I toss the coin 10 times, then what is the probability I get heads more than seven times?”, or, “If the subject does the prognostication experiment described 50 times (and has no prognostic ability), what is the chance she gets the right answer more than 30 times?”

When we teach students about the binomial distribution we tell them that the number of trials (coin tosses) must be fixed before the experiment is conducted, otherwise the theory does not apply. However, if you take the example from Steve Lindsay, “..I did 20 experiments, how about I add 12 more,” then it can be hard to see what is wrong in doing so. I think the counterintuitive nature of this relates to general misunderstanding of conditional probability. When we encounter a problem like this, our response is “Well I can’t see the difference between 10 out of 20, versus 16 out of 32.” What we are missing here is that the results of the first 20 experiments are already known. That is, there is no longer any probability attached to the outcomes of these experiments. What we need to calculate is the probability of a certain number of successes, say x given that we have already observed y successes.

Let us take the numbers given by Professor Lindsay of 20 experiments followed a further 12. Further to this we are going to describe “almost significant” in 20 experiments as 12, 13, or 14 successes, and “significant” as 23 or more successes out of 32. I have chosen these numbers because (if we believe in hypothesis testing) we would observe 15 or more “heads” out of 20 tosses of a fair coin fewer than 21 times in 1,000 (on average). That is, observing 15 or more heads in 20 coin tosses is fairly unlikely if the coin is fair. Similarly, we would observe 23 or more heads out of 32 coin tosses about 10 times in 1,000 (on average).

So if we have 12 successes in the first 20 experiments, we need another 11 or 12 successes in the second set of experiments to reach or exceed our threshold of 23. This is fairly unlikely. If successes happen by random chance alone, then we will get 11 or 12 with probability 0.0032 (about 3 times in 1,000). If we have 13 successes in the first 20 experiments, then we need 10 or more successes in our second set to reach or exceed our threshold. This will happen by random chance alone with probability 0.019 (about 19 times in 1,000). Although it is an additively huge difference, 0.01 vs 0.019, the probability of exceeding our threshold has almost doubled. And it gets worse. If we had 14 successes, then the probability “jumps” to 0.073 — over seven times higher. It is tempting to think that this occurs because the second set of trials is smaller than the first. However, the phenomenon exists then as well.

The issue exists because the probability distribution for all of the results of experiments considered together is not the same as the probability distribution for results of the second set of experiments given we know the results of the first set of experiment. You might think about this as being like a horse race where you are allowed to make your bet after the horses have reached the half way mark — you already have some information (which might be totally spurious) but most people will bet differently, using the information they have, than they would at the start of the race.
May 28, 2015

Junk food science

In an interesting sting on the world of science journalism, John Bohannon and two colleagues, plus a German medical doctor, ran a small randomised experiment on the effects of chocolate consumption, and found better weight loss in those given chocolate. The experiment was real and the measurements were real, but the medical journal  was the sort that published their paper two weeks after submission, with no changes.

Here’s a dirty little science secret: If you measure a large number of things about a small number of people, you are almost guaranteed to get a “statistically significant” result. Our study included 18 different measurements—weight, cholesterol, sodium, blood protein levels, sleep quality, well-being, etc.—from 15 people. (One subject was dropped.) That study design is a recipe for false positives.

Think of the measurements as lottery tickets. Each one has a small chance of paying off in the form of a “significant” result that we can spin a story around and sell to the media. The more tickets you buy, the more likely you are to win. We didn’t know exactly what would pan out—the headline could have been that chocolate improves sleep or lowers blood pressure—but we knew our chances of getting at least one “statistically significant” result were pretty good.

Bohannon and his conspirators were doing this deliberately, but lots of people do it accidentally. Their study was (deliberately) crappier than average, but since the journalists didn’t ask, that didn’t matter. You should go read the whole thing.

Finally, two answers for obvious concerns: first, the participants were told the research was for a documentary on dieting, not that it was in any sense real scientific research. Second: no, neither Stuff nor the Herald fell for it.

 [Update: Although there was participant consent, there wasn’t ethics committee review. An ethics committee probably wouldn’t have allowed it. Hilda Bastian on Twitter]

July 24, 2014

Weak evidence but a good story

An example from Stuff, this time

Sah and her colleagues found that this internal clock also affects our ability to behave ethically at different times of day. To make a long research paper short, when we’re tired we tend to fudge things and cut corners.

Sah measured this by finding out the chronotypes of 140 people via a standard self-assessment questionnaire, and then asking them to complete a task in which they rolled dice to win raffle tickets – higher rolls, more tickets.

Participants were randomly assigned to either early morning or late evening sessions. Crucially, the participants self-reported their dice rolls.

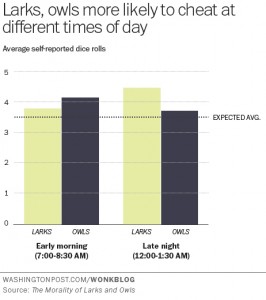
You’d expect the dice rolls to average out to around 3.5. So the extent to which a group’s average exceeds this number is a measure of their collective result-fudging.

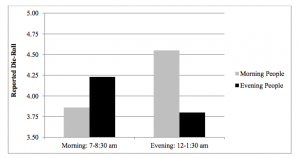
“Morning people tended to report higher die-roll numbers in the evening than the morning, but evening people tended to report higher numbers in the morning than the evening,” Sah and her co-authors wrote.

The research paper is here.  The Washington Post, where the story was taken from, has a graph of the results, and they match the story. Note that this is one of the very few cases where starting a bar chart at zero is a bad idea. It’s hard to roll zero on a standard die.

larks-owls-wapost


The research paper also has a graph of the results, which makes the effect look bigger, but in this case is defensible as 3.5 really is “zero” for the purposes of the effect they are studying

lark-owl


Unfortunately,neither graph has any indication of uncertainty. The evidence of an effect is not negligible, but it is fairly weak (p-value of 0.04 from 142 people). It’s easy to imagine someone might do an experiment like this and not publish it if they didn’t see the effect they expected, and it’s pretty certain that you wouldn’t be reading about the results if they didn’t see the effect they expected, so it makes sense to be a bit skeptical.

The story goes on to say

These findings have pretty big implications for the workplace. For one, they suggest that the one-size-fits-all 9-to-5 schedule is practically an invitation to ethical lapses.

Even assuming that the effect is real and that lying about a die roll in a psychological experiment translates into unethical behaviour in real life, the findings don’t say much about the ‘9-to-5’ schedule. For a start, none of the testing was conducted between 9am and 5pm.


April 4, 2014

Thomas Lumley’s latest Listener column

…”One of the problems in developing drugs is detecting serious side effects. People who need medication tend to be unwell, so it’s hard to find a reliable comparison. That’s why the roughly threefold increase in heart-attack risk among Vioxx users took so long to be detected …”

Read his column, Faulty Powers, here.

November 27, 2013

Interpretive tips for understanding science

From David Spiegelhalter, William Sutherland, and Mark Burgman, twenty (mostly statistical) tips for interpreting scientific findings

To this end, we suggest 20 concepts that should be part of the education of civil servants, politicians, policy advisers and journalists — and anyone else who may have to interact with science or scientists. Politicians with a healthy scepticism of scientific advocates might simply prefer to arm themselves with this critical set of knowledge.

A few of the tips, without their detailed explication:

  • Differences and chance cause variation
  • No measurement is exact
  • Bigger is usually better for sample size
  • Controls are important
  • Beware the base-rate fallacy
  • Feelings influence risk perception
November 19, 2013

Tune in, turn on, drop out?

From online site Games and Learning

A massive study of some 11,000 youngsters in Britain has found that playing video games, even as early as five years old, does not lead to later behavior problems.

This is real research, looking at changes over time in a large number of children and it does find that the associations between ‘screen time’ and later behaviour problems are weak. On the other hand, the research paper concludes

 Watching TV for 3 h or more at 5 years predicted a 0.13 point increase (95% CI 0.03 to 0.24) in conduct problems by 7 years, compared with watching for under an hour, but playing electronic games was not associated with conduct problems.

When you see “was not associated”, you need to look carefully: are they claiming evidence of absence or just weakness of evidence. Here are the estimates in a graphical form, comparing changes in a 10-point questionnaire about conduct.

video


The data largely rule out average differences as big as half a point, so this study does provide evidence there isn’t a big impact (in the UK). However, it’s pretty clear from the graph that the data don’t provide any real support for a difference between TV and videogames.  The estimates for TV are more precise, and for that reason the TV estimate is ‘statistically significant’ and the videogames one isn’t, but that’s not evidence of difference.

It’s also interesting  that there’s mild support in the data for ‘None’ being worse than a small amount. Here the precision is higher for the videogame estimate, because there are very few children who watch no TV (<2%).

June 27, 2013

Making sense of uncertainty

Sense about Science (a British charity whose name, unusually, is actually accurate) have just launched a publication “Making Sense of Uncertainty”, following their previous guides for the public and journalists that cover screening, medical tests, chemical stories, statistics, and radiation.

Researchers in climate science, disease modelling, epidemiology, weather forecasting and natural hazard prediction say that we should be relieved when scientists describe the uncertainties in their work. It doesn’t necessarily mean that we cannot make decisions – we might well have ‘operational knowledge’ – but it does mean that there is greater confidence about what is known and unknown.
Launching a guide to Making Sense of Uncertainty at the World Conference of Science Journalists today, researchers working in some of the most significant, cutting edge fields say that if policy makers and the public are discouraged by the existence of uncertainty, we miss out on important discussions about the development of new drugs, taking action to mitigate the impact of natural hazards, how to respond to the changing climate and to pandemic threats.
Interrogated with the question ‘But are you certain?’, they say, they have ended up sounding defensive or as though their results are not meaningful. Instead we need to embrace uncertainty, especially when trying to understand more about complex systems, and ask about operational knowledge: ‘What do we need to know to make a decision? And do we know it?’ 

Guide to reporting clinical trials

From the World Conference of Science Journalists, via @roobina (Ruth Francis), ten tweets on reporting clinical trials

  1. Was this #trial registered before it began? If not then check for rigged design, or hidden negative results on similar trials.
  2. Is primary outcome reported in paper the same as primary outcome spec in protocol? If no report maybe deeply flawed.
  3. Look for other trials by co or group, or on treatment, on registries to see if it represents cherry picked finding
  4. ALWAYS mention who funded the trial. Do any of ethics committee people have some interest with the funding company
  5. Will country where work is done benefit? Will drug be available at lower cost? Is disorder or disease a problem there
  6. How many patients were on the trial, and how many were in each arm?
  7. What was being compared (drug vs placebo? Drug vs standard care? Drug with no control arm?
  8. Be precise about people/patient who benefited – advanced disease, a particular form of a disease?
  9. Report natural frequencies: “13 people per 10000 experienced x”, rather than “1.3% of people experienced x”
  10. NO relative risks. Paint findings clearly: improved survival by 3%: BAD. Ppl lived 2 months longer on average: GOOD

Who says you can’t say anything useful in 140 characters?

June 20, 2013

Does success in education rely on having certain genes?

If you have read media stories recently that say ‘yes’, you’d better read this article from the Genetic Literacy Project …