Posts filed under Risk (222)

May 4, 2015

On algorithmic transparency

An important emerging area of statistics is algorithmic transparency: what information is your black-box analytics system really relying on, and should it?

From Matt Levine

The materiality standard that controls so much of securities law comes from an earlier, simpler time; a time when reasonable people could look at a piece of information and say “oh, yes, of course that will move the stock up” (or down), and if they couldn’t then they wouldn’t bother with it. Modern financial markets are not so intuitive: Algorithms are interested in information that reasonable humans cannot process, with the result that reasonable humans can’t always predict how significant any piece of information is. That’s a world that is more complicated for investors, but it also seems to me to be more complicated for insider trading regulation. And I’m not sure that regulation has really kept up.


April 13, 2015

Puppy prostate perception

The Herald tells us “Dogs have a 98 per cent reliability rate in sniffing out prostate cancer, according to newly-published research.” Usually, what’s misleading about this sort of conclusion is the base-rate problem: if a disease is rare, 98% accuracy isn’t good enough. Prostate cancer is different.

Blood tests for prostate cancer are controversial because prostate tumours are common in older men, but only some tumours progress to cause actual illness.  By “controversial” I don’t mean the journalistic euphemism for “there are a few extremists who aren’t convinced”, but actually controversial.  Groups of genuine experts, trying to do the best for patients, can come to very different conclusions on when testing is beneficial.

The real challenge in prostate cancer screening is to distinguish the tumours you don’t want to detect from the ones you really, really do want to detect. The real question for the canine sniffer test is how well it does on this classification.

Since the story doesn’t give the researchers’s names finding the actual research takes more effort than usual. When you track the paper down it turns out that the dogs managed almost perfect discrimination between men with prostate tumours and everyone else. They detected tumours that were advanced and being treated, low-risk tumours that had been picked up by blood tests, and even minor tumours found incidentally in treatment for prostate enlargement. Detection didn’t depend on tumour size, on stage of disease, on PSA levels, or basically anything. As the researchers observed “The independence of tumor volume and aggressiveness, and the dog detection rate is surprising.”

Surprising, but also disappointing. Assuming the detection rate is real — and they do seem to have taken precautions against the obvious biases — the performance of the dogs is extremely impressive. However, the 98% accuracy in distinguishing people with and without prostate tumours unavoidably translates into a much lower accuracy in distinguishing tumours you want to detect from those you don’t want to detect.

March 25, 2015

Foreign drivers, yet again

From the Stuff front page
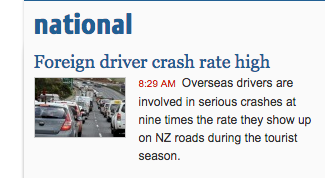
ninetimes

Now, no-one (maybe even literally no-one) is denying that foreign drivers are at higher risk on average. It’s just that some of us feel exaggerating the problem is unhelpful. The quoted sentence is true only if “the tourist season” is defined, a bit unconventionally, to mean “February”, and probably not even then.

When you click through to the story (from the ChCh Press), the first thing you see is this:
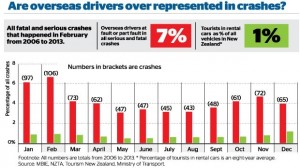
1427225389525

Notice how the graph appears to contradicts itself: the proportion of serious crashes contributed to by a foreign driver ranges from just over 3% in some months to just under 7% at the peak.  Obviously, 7% is an overstatement of the actual problem, and if you read sufficiently carefully, the graphs says so.  The average is actually 4.3%

The other number headlined here is 1%: cars rented by tourists as a fraction of all vehicles.  This is probably an underestimate, as the story itself admits (well, it doesn’t admit the direction of the bias). But the overall bias isn’t what’s most relevant here, if you look at how the calculation is done.

Visitor surveys show that about 1 million people visited Canterbury in 2013.

About 12.6 per cent of all tourists in 2013 drove rental cars, according to government visitor surveys. That means about 126,000 of those 1 million Canterbury visitors drove rental cars. About 10 per cent of international visitors come to New Zealand in January, which means there were about 12,600 tourists in rental cars on Canterbury roads in January.

This was then compared to the 500,000 vehicles on the Canterbury roads in 2013 – figures provided by the Ministry of Transport.

The rental cars aren’t actually counted, they are treated as a constant fraction of visitors. If visitors in summer are more likely to drive long distances, which seems plausible, the denominator will be relatively underestimated in summer and overestimated in winter, giving an exaggerated seasonal variation in risk.

That is, the explanation for more crashes involving foreign drivers in summer could be because summer tourists stay longer or drive more, rather than because summer tourists are intrinsically worse drivers than winter tourists.

All in all, “nine times higher” is a clear overstatement, even if you think crashes in February are somehow more worth preventing than crashes in other months.

Banning all foreign drivers from the roads every February would have prevented 106 fatal or serious injury crashes over the period 2006-2013, just over half a percent of the total.  Reducing foreign driver risk by 14%  over the whole year would have prevented 109 crashes. Reducing everyone’s risk by 0.6%  would have prevented about 107 crashes. Restricting attention to February, like restricting attention to foreign drivers, only makes sense to the extent that it’s easier or less expensive to reduce some people’s risk enormously than to reduce everyone’s risk a tiny amount.


Actually doing something about the problem requires numbers that say what the problem actually is, and strategies, with costs and benefits attached. How many tens of millions of dollars worth of tourists would go elsewhere if they weren’t allowed to drive in New Zealand? Is there a simple, quick test would separate safe from dangerous foreign drivers, that rental companies could administer? How could we show it works? Does the fact that rental companies are willing to discriminate against young drivers but not foreign drivers mean there’s something wrong with anti-discrimination law, or do they just have a better grip on the risks? Could things like rumble strips and median barriers help more for the same cost? How about more police presence?

From 2006 to 2013 NZ averaged about 6 crashes per day causing serious or fatal injury. On average, about one every four days involved a foreign driver. Both these numbers are too high.


March 19, 2015

Model organisms

The flame retardant chemicals in your phone made zebra fish “chubby”, says the caption on this photo at news.com.au. Zebra fish, as it explains, are a common model organism for medical research, so this could be relevant to people

591917-2a8735a0-cced-11e4-a716-dcac481e1bbe

On the other hand, as @LewSOS points out on Twitter, it doesn’t seem to be having the same effect on the model organisms in the photo.

What’s notable about the story is how much better it is than the press release, which starts out

Could your electronics be making you fat? According to University of Houston researchers, a common flame retardant used to keep electronics from overheating may be to blame.

The news.com.au story carefully avoids repeating this unsupported claim.  Also, the press release doesn’t link to the research paper, or even say where it was published (or even that it was published). That’s irritating in the media but unforgivable in a university press release.   When you read the paper it turns out the main research finding was that looking at fat accumulation in embryonic zebrafish (which is easy because they are transparent, one of their other advantages over mice) was a good indication of weight gain later in life, and might be a useful first step in deciding which chemicals were worth testing in mice.

So, given all that, does your phone or computer actually expose you to any meaningful amount of this stuff?

The compounds in question, Tetrabromobisphoneol A (TBBPA) and tetrachlorobisphenol A (TCBPA) can leach out of the devices and often end up settling on dust particles in the air we breathe, the study found.

That’s one of the few mistakes in the story: this isn’t what the study found, it’s part of the background information. In any case, the question is how much leaches out. Is it enough to matter?

The European Union doesn’t think so

The highest inhalation exposures to TBBP-A were found in the production (loading and mixing) of plastics, with 8-hour time-weighted-averages (TWAs) up to 12,216 μg/m3 . At the other end of the range, offices containing computers showed TBBP-A air concentrations of less than 0.001 μg/m3 . TBBP-A exposures at sites where computers were shredded, or where laminates were manufactured ranged from 0.1 to 75 μg/m3 .

You might worry about the exposures from plastics production, and about long-term environmental accumulations, but it looks like TBBP-A from being around a phone isn’t going to be a big contributor to obesity. That’s also what the international comparisons would suggest — South Korea and Singapore have quite a lot more smartphone ownership than Australia, and Norway and Sweden are comparable, all with much less obesity.

March 16, 2015

Maps, colours, and locations

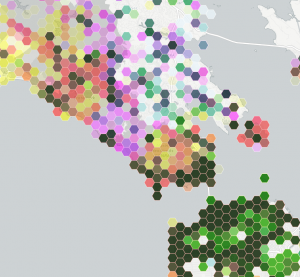
This is part of a social media map, of photographs taken in public places in the San Francisco Bay Area

bayarea

The colours are trying to indicate three social media sites: Instagram is yellow, Flickr is magenta, Twitter is cyan.

Encoding three variables with colour this way doesn’t allow you to easily read off differences, but you can see clusters and then think about how to decode them into data. The dark green areas are saturated with photos.  Light green urban areas have Instagram and Twitter, but not much Flickr.  Pink and orange areas lack Twitter — mostly these track cellphone coverage and population density, but not entirely.  The pink area in the center of the map is spectacular landscape without many people; the orange blob on the right is the popular Angel Island park.

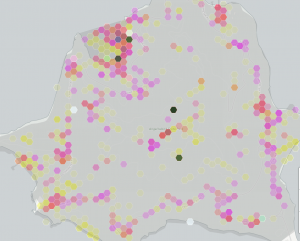
Zooming in on Angel Island shows something interesting: there are a few blobs with high density across all three social media systems. The two at the top are easily explained: the visitor centre and the only place on the island that sells food. The very dense blob in the middle of the island, and the slightly less dense one below it are a bit strange. They don’t seem to correspond to any plausible features.

angelisland

My guess is that these are a phenomenon we’ve seen before, of locations being mapped to the center of some region if they can’t be specified precisely.

Automated data tends to be messy, and making serious use of it means finding out the ways it lies to you. Wayne Dobson doesn’t have your cellphone, and there isn’t a uniquely Twitter-worthy bush in the middle of Angel Island.


March 9, 2015

Not all there

One of the most common problems with data is that it’s not there. Families don’t answer their phones, over-worked nurses miss some forms, and even tireless electronic recorders have power failures.

There’s a large field of statistical research devoted to ways of fixing the missing-data problem. None of them work — that’s not my cynical opinion, that’s a mathematical theorem — but many of them are more likely to make things better than worse.  The best ways to handle data you don’t have depends on what sort of data and why you don’t have it, but even the best ways can confuse people who aren’t paying attention.

Just ignoring the missing data problem and treating the data you have as all the data is effectively assuming the missing data look just like the observed data. This is often very implausible. For example, in a weight-loss study it is much more likely that people who aren’t losing weight will drop out. If you just analyse data from people who stay in the study and follow all your instructions, unless this is nearly everyone, they will probably have lost weight (on average) even if your treatment is just staring at a container of felt-tip pens.

That’s why it is often sensible to treat missing observations as if they were bad. The Ministry of Health drinking water standards do this.  For example, they say that only 96.7% of New Zealand received water complying with the bacteriological standards. That sounds serious. Of the 3.3% failures, however, more than half (2.0%) were just failures to monitor thoroughly enough, and only 0.1% had E. coli transgression that were not followed up by immediate corrective action.

From a regulatory point of view, lumping these together makes sense. The Ministry doesn’t want to create incentives for data to ‘accidentally’ go missing whenever there’s a problem. From a public health point of view, though, you can get badly confused if you just look at the headline compliance figure and don’t read down to page 18.

The Ministry takes a similarly conservative approach to the other standards, and the detailed explanations are more reassuring than the headline compliance figures. There are a small number of water supplies with worrying levels of arsenic — enough to increase lifetime cancer risk by a tenth of a percentage point or so — but in general the biggest problem is inadequate fluoride concentrations in drinking water for nearly half of Kiwi kids.


February 27, 2015

Quake prediction: how good does it need to be?

From a detailed story in the ChCh Press, (via Eric Crampton) about various earthquake-prediction approaches

About 40 minutes before the quake began, the TEC in the ionosphere rose by about 8 per cent above expected levels. Somewhat perplexed, he looked back at the trend for other recent giant quakes, including the February 2010 magnitude 8.8 event in Chile and the December 2004 magnitude 9.1 quake in Sumatra. He found the same increase about the same time before the quakes occurred.

Heki says there has been considerable academic debate both supporting and opposing his research.

To have 40 minutes warning of a massive quake would be very useful indeed and could help save many lives. “So, why 40 minutes?” he says. “I just don’t know.”

He says if the link were to be proved more firmly in the future it could be a useful warning tool. However, there are drawbacks in that the correlation only appears to exist for the largest earthquakes, whereas big quakes of less than magnitude 8.0 are far more frequent and still cause death and devastation. Geomagnetic storms can also render the system impotent, with fluctuations in the total electron count masking any pre-quake signal.

Let’s suppose that with more research everything works out, and there is a rise in this TEC before all very large quakes. How much would this help in New Zealand? The obvious place is Wellington. A quake over 8.0 magnitude has been observed in the area in 1855, when it triggered a tsunami. A repeat would also shatter many of the earthquake-prone buildings. A 40-minute warning could save many lives. It appears that TEC shouldn’t be that expensive to measure: it’s based on observing the time delays in GPS satellite transmissions as they pass through the ionosphere, so it mostly needs a very accurate clock (in fact, NASA publishes TEC maps every five minutes). Also, it looks like it would be very hard to hack the ionosphere to force the alarm to go off. The real problem is accuracy.

The system will have false positives and false negatives. False negatives (missing a quake) aren’t too bad, since that’s where you are without the system. False positives are more of a problem. They come in two forms: when the alarm goes off completely in the absence of a quake, and when there is a quake but no tsunami or catastrophic damage.

Complete false predictions would need to be very rare. If you tell everyone to run for the hills and it turns out to be sunspots or the wrong kind of snow, they will not be happy: the cost in lost work (and theft?) would be substantial, and there would probably be injuries.  Partial false predictions, where there was a large quake but it was too far away or in the wrong direction to cause a tsunami, would be just as expensive but probably wouldn’t cause as much ill-feeling or skepticism about future warnings.

Now for the disappointment. The story says “there has been considerable academic debate”. There has. For example, in a (paywalled) paper from 2013 looking at the Japanese quake that prompted Heki’s idea

A detailed analysis of the ionospheric variability in the 3 days before the earthquake is then undertaken, where a simultaneous increase in foF2 and the Es layer peak plasma frequency, foEs, relative to the 30-day median was observed within 1 h before the earthquake. A statistical search for similar simultaneous foF2 and foEs increases in 6 years of data revealed that this feature has been observed on many other occasions without related seismic activity. Therefore, it is concluded that one cannot confidently use this type of ionospheric perturbation to predict an impending earthquake.

In translation: you need to look just right to see this anomaly, and there are often anomalies like this one without quakes. Over four years they saw 24 anomalies, only one shortly before a quake.  Six complete false positives per year is obviously too many.  Suppose future research could refine what the signal looks like and reduce the false positives by a factor of ten: that’s still evacuation alarms with no quake more than once every two years. I’m pretty sure that’s still too many.


Siberian hamsters or Asian gerbils

Every year or so there is a news story along the lines of”Everything you know about the Black Death is Wrong”. I’ve just been reading a couple of excellent posts  by Alison Atkin on this year’s one.

The Herald’s version of the story (which they got from the Independent) is typical (but she has captured a large set of headlines)

The Black Death has always been bad publicity for rats, with the rodent widely blamed for killing millions of people across Europe by spreading the bubonic plague.

But it seems that the creature, in this case at least, has been unfairly maligned, as new research points the finger of blame at gerbils.

and

The scientists switched the blame from rat to gerbil after comparing tree-ring records from Europe with 7711 historical plague outbreaks.

That isn’t what the research paper (in PNAS) says. And it would be surprising if it did: could it really be true that Asian gerbils were spreading across Europe for centuries without anyone noticing?

The abstract of the paper says

The second plague pandemic in medieval Europe started with the Black Death epidemic of 1347–1353 and killed millions of people over a time span of four centuries. It is commonly thought that after its initial introduction from Asia, the disease persisted in Europe in rodent reservoirs until it eventually disappeared. Here, we show that climate-driven outbreaks of Yersinia pestis in Asian rodent plague reservoirs are significantly associated with new waves of plague arriving into Europe through its maritime trade network with Asia. This association strongly suggests that the bacterium was continuously reimported into Europe during the second plague pandemic, and offers an alternative explanation to putative European rodent reservoirs for how the disease could have persisted in Europe for so long.

If the researchers had found repeated, prevously unsuspected, invasions of Europe by hordes of gerbils, they would have said so in the abstract. They don’t. Not a gerbil to be seen.

The hypothesis is that plague was repeatedly re-imported from Asia (where affected a lots of species, including, yes, gerbils) to European rats, rather than persisting at low levels in European rats between the epidemics. Either way, once the epidemic got to Europe, it’s all about the rats [update: and other non-novel forms of transmission]

In this example, for a change, it doesn’t seem that the press release is responsible. Instead, it looks like progressive mutations in the story as it’s transmitted, with the great gerbil gradually going from an illustrative example of a plague host in Asia to the rodent version of Attila the Hun.

Two final remarks. First, the erroneous story is now in the Wikipedia entry for the great gerbil (with a citation to the PNAS paper, so it looks as if it’s real). Second, when the story is allegedly about the confusion between two species of rodent, it’s a pity the Herald stock photo isn’t the right species.


[Update: Wikipedia has been fixed.]

February 25, 2015

Measuring what you care about

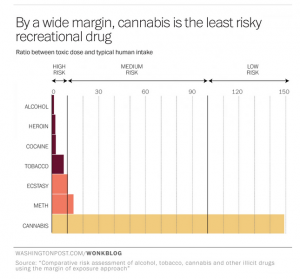
If cannabis is safer than thought (as the Washington Post says), that might explain why the reporting is careful to stay away from thought.

thought


The problem with this new research is that it’s looking at the acute toxicity of drugs — how does the dose people usually take compare to the dose needed to kill you right away.  It’s hard to overstate how unimportant this is in debates over regulation of alcohol, tobacco, and cannabis.  There’s some concern about alcohol poisoning (in kids, mostly), but as far as I can remember I have literally never seen anti-tobacco campaigns mentioning acute nicotine poisoning as a risk, and even the looniest drug warriors don’t push fatal THC overdoses as the rationale for banning marijuana.

Alcohol is dangerous not primarily because of acute poisoning, but because of car crashes, violence, cancer, liver failure, and heart damage. Tobacco is dangerous not primarily because of acute poisoning, but because of lung cancer, COPD, heart disease, stroke, and other chronic diseases.

It’s hard to tell how dangerous marijuana is. It certainly causes dependence in some users, and there are reasons to think it might have psychological and neurological effects. If smoked, it probably damages the lungs. In all these cases, though, the data on frequency and severity of long-term effects are limited.  We really don’t know, and the researchers didn’t even try to estimate.

The conclusions of the researchers — that cannabis is over-regulated and over-panicked-about relative to other drugs — are reasonable, but the data provide very little support for them.  If the researchers had used the same methodology on caffeine, it would have looked much more dangerous than cannabis, and probably more dangerous than methamphetamine. That would have been a bit harder to sell, even with a pretty graph.


[story now in Herald, too]

February 19, 2015

London card clash sensitivity analysis

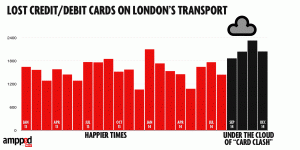
The data blog of the Daily Mirror reports a problem with ‘card clash’ on the London Underground.  You can now pay directly with a debit card instead of buying a ticket — so if you have both a transport card and a debit card in your wallet, you have the opportunity to enter with one and leave with the other and get overcharged. Alternatively, you can take the card out of your wallet and drop it.  Auckland Transport has a milder version of the same problem: no-touch credit cards can confuse the AT HOP reader and make it not recognise your card, but you won’t get overcharged unless you don’t notice the red light.

They looked at numbers of cards handed in at lost-and-found across the London Underground over the past two years (based on FOI request)

card-clash

If we’re going to spend time on this, we might also consider what the right comparison is. The data include cards on their own and cards with other stuff, such as a wallet. We shouldn’t combine them: the ‘card clash’ hypothesis would suggest a bigger increase in cards on their own.

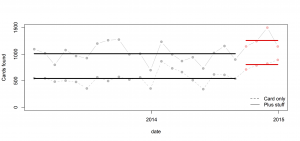
Here’s a comparison using all the data: the pale points are the observations, the heavy lines are means.

allcards

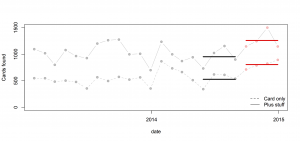
Or, we might worry about trends over time and use just the most recent four months of comparison data:

recentcards

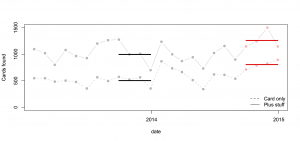
Or, use the same four months of the previous year:

matchedcards


In this case all the comparisons give basically the same conclusion: more cards are being handed in, but the increase is pretty similar for cards alone and for cards with other stuff, which weakens the support for the ‘card clash’ explanation.

Also, in the usual StatsChat spirit of considering absolute risks: there are 3.5 million trips per day, and about 55 cards handed in per day: one card for about 64000 trips. With two trips per day, 320 days per year, that would average once per person per century.