Posts filed under Risk (222)

August 5, 2015

What does 90% accuracy mean?

There was a lot of coverage yesterday about a potential new test for pancreatic cancer. 3News covered it, as did One News (but I don’t have a link). There’s a detailed report in the Guardian, which starts out:

A simple urine test that could help detect early-stage pancreatic cancer, potentially saving hundreds of lives, has been developed by scientists.

Researchers say they have identified three proteins which give an early warning of the disease, with more than 90% accuracy.

This is progress; pancreatic cancer is one of the diseases where there genuinely is a good prospect that early detection could improve treatment. The 90% accuracy, though, doesn’t mean what you probably think it means.

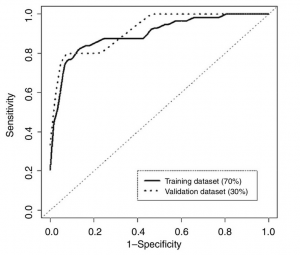
Here’s a graph showing how the error rate of the test changes with the numerical threshold used for diagnosis (figure 4, panel B, from the research paper)

pancreatic

As you move from left to right the threshold decreases; the test is more sensitive (picks up more of the true cases), but less specific (diagnoses more people who really don’t have cancer). The area under this curve is a simple summary of test accuracy, and that’s where the 90% number came from.  At what the researchers decided was the optimal threshold, the test correctly reported 82% of early-stage pancreatic cancers, but falsely reported a positive result in 11% of healthy subjects.  These figures are from the set of people whose data was used in putting the test together; in a new set of people (“validation dataset”) the error rate was very slightly worse.

The research was done with an approximately equal number of healthy people and people with early-stage pancreatic cancer. They did it that way because that gives the most information about the test for given number of people.  It’s reasonable to hope that the area under the curve, and the sensitivity and specificity of the test will be the same in the general population. Even so, the accuracy (in the non-technical meaning of the word) won’t be.

When you give this test to people in the general population, nearly all of them will not have pancreatic cancer. I don’t have NZ data, but in the UK the current annual rate of new cases goes from 4 people out of 100,000 at age 40 to 100 out of 100,000 people 85+.   The average over all ages is 13 cases per 100,000 people per year.

If 100,000 people are given the test and 13 have early-stage pancreatic cancer, about 10 or 11 of the 13 cases will have positive tests, but so will 11,000 healthy people.  Of those who test positive, 99.9% will not have pancreatic cancer.  This might still be useful, but it’s not what most people would think of as 90% accuracy.
 

July 28, 2015

Recreational genotyping: potentially creepy?

Two stories from this morning’s Twitter (via @kristinhenry)

  • 23andMe has made available a programming interface (API) so that you can access and integrate your genetic information using apps written by other people.  Someone wrote and published code that could be used to screen users based on sex and ancestry. (Buzzfeed, FastCompany). It’s not a real threat, since apps with more than 20 users need to be reviewed by 23andMe, and since users have to agree to let the code use their data, and since Facebook knows far more about you than 23andMe, but it’s not a good look.
  • Google’s Calico project also does cheap public genotyping and is combining their DNA data (more than a million people) with family trees from Ancestry.com. This is how genetic research used to be done: since we know how DNA is inherited, connecting people with family trees deep into the past provides a lot of extra information. On the other hand, it means that if a few distantly-related people sign up for Calico genotying, Google will learn a lot about the genomes of all their relatives.

It’s too early to tell whether the people who worry about this sort of thing will end up looking prophetic or just paranoid.

July 24, 2015

Are beneficiaries increasingly failing drug test?

Stuff’s headline is “Beneficiaries increasingly failing drug tests, numbers show”.

The numbers are rates per week of people failing or refusing drug tests. The number was 1.8/week for the first 12 weeks of the policy and 2.6/week for the whole year 2014, and, yes, 2.6 is bigger than 1.8.  However, we don’t know how many tests were performed or demanded, so we don’t know how much of this might be an increase in testing.

In addition, if we don’t worry about the rate of testing and take the numbers at face value, the difference is well within what you’d expect from random variation, so while the numbers are higher it would be unwise to draw any policy conclusions from the difference.

On the other hand, the absolute numbers of failures are very low when compared to the estimates in the Treasury’s Regulatory Impact Statement.

MSD and MoH have estimated that once this policy is fully implemented, it may result in:

• 2,900 – 5,800 beneficiaries being sanctioned for a first failure over a 12 month period

• 1,000 – 1,900 beneficiaries being sanctioned for a second failure over a 12 month period

• 500 – 1,100 beneficiaries being sanctioned for a third failure over a 12 month period.

The numbers quoted by Stuff are 60 sanctions in total over eighteen months, and 134 test failures over twelve months.  The Minister is quoted as saying the low numbers show the program is working, but as she could have said the same thing about numbers that looked like the predictions, or numbers that were higher than the predictions, it’s also possible that being off by an order of magnitude or two is a sign of a problem.


July 22, 2015

Are reusable shopping bags deadly?

There’s a research report by two economists arguing that San Francisco’s bag on plastic shopping bags has led to a nearly 50% increase in deaths from foodborne disease, an increase of about 5.5 deaths per year.  I was asked my opinion on Twitter. I don’t believe it.

What the analysis does show is some evidence that emergency room visits for foodborne disease have increased: the researchers analysed admissions for E. coli, Salmonella, and Campylobacter infection, and found an increase in San Francisco but not in neighbouring counties. There’s a statistical issue in that the number of counties is small and the standard error estimates tend to be a bit unreliable in that setting, but that’s not prohibitive. There’s also a statistical issue in that we don’t know which (if any) infections were related to contamination of raw food, but again that’s not prohibitive.

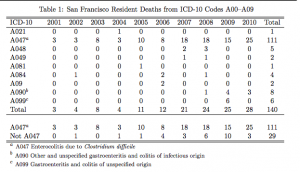
The problem with the analysis of deaths is the definition: the deaths in the analysis were actually all of the ICD10 codes A00-A09. Most of this isn’t foodborne bacterial disease, and a lot of the deaths from foodborne bacterial disease will be in settings where shopping bags are irrelevant. In particular, two important contributors are

  • Clostridium difficile infections after antibiotic use, which has a fairly high mortality rate
  • Diarrhoea in very frail elderly people, in residential aged care or nursing homes.

In the first case, this has nothing to do with food. In the second case, it’s often person-to-person transmission (with norovirus a leading cause), but even if it is from food, the food isn’t carried in reusable shopping bags.

Tomás Aragón with the San Francisco department of Public Health, has a more detailed breakdown of the death data than were available to the researchers. His memo I think is too negative on the statistical issues, but the data underlying the A00-A09 categories are pretty convincing:

aragon

Category A021 is Salmonella (other than typhoid); A048 and A049 are other miscellaneous bacterial infections; A081 and A084 are viral. A090 and A099 are left-over categories that are supposed to exclude foodborne disease but will capture some cases where the mechanism of infection wasn’t known.  A047 is Clostridium difficile.   The apparent signal is in the wrong place. It’s not obvious why the statistical analysis thinks it has found evidence of an effect of the plastic-bag ban, but it is obvious that it hasn’t.

Here, for comparison, are New Zealand mortality data for specific foodborne infections, from foodsafety.govt.nz, the most recent year available

nz

Over the three years, there were only ten deaths where the underlying cause was one of these food-borne illnesses — a lot of people get sick, but very few die.


The mortality data don’t invalidate the analysis of hospital admissions, where there’s a lot more information and it is actually about (potentially) foodborne diseases.  More data from other cities — especially ones that are less atypical than San Francisco — would be helpful here, and it’s possible that this is a real effect of reusing bags. The economic analysis,however, relies heavily on the social costs of deaths.

July 11, 2015

What’s in a name?

The Herald was, unsurprisingly, unable to resist the temptation of leaked data on house purchases in Auckland.  The basic points are:

  • Data on the names of buyers for one agency, representing 45% fo the market, for three months
  • Based on the names, an estimate that nearly 40% of the buyers were of Chinese ethnicity
  • This is more than the proportion of people of Chinese ethnicity in Auckland
  • Oh Noes! Foreign speculators! (or Oh Noes! Foreign investors!)

So, how much of this is supported by the various data?

First, the surnames.  This should be accurate for overall proportions of Chinese vs non-Chinese ethnicity if it was done carefully. The vast majority of people called, say, “Smith” will not be Chinese; the vast majority of people called, say, “Xu” will be Chinese; people called “Lee” will split in some fairly predictable proportion.  The same is probably true for, say, South Asian names, but Māori vs non-Māori would be less reliable.

So, we have fairly good evidence that people of Chinese ancestry are over-represented as buyers from this particular agency, compared to the Auckland population.

Second: the representativeness of the agency. It would not be at all surprising if migrants, especially those whose first language isn’t English, used real estate agents more than people born in NZ. It also wouldn’t be surprising if they were more likely to use some agencies than others. However, the claim is that these data represent 45% of home sales. If that’s true, people with Chinese names are over-represented compared to the Auckland population no matter how unrepresentative this agency is. Even if every Chinese buyer used this agency, the proportion among all buyers would still be more than 20%.

So, there is fairly good evidence that people of Chinese ethnicity are buying houses in Auckland at a higher rate than their proportion of the population.

The Labour claim extends this by saying that many of the buyers must be foreign. The data say nothing one way or the other about this, and it’s not obvious that it’s true. More precisely, since the existence of foreign investors is not really in doubt, it’s not obvious how far it’s true. The simple numbers don’t imply much, because relatively few people are housing buyers: for example, house buyers named “Wang” in the data set are less than 4% of Auckland residents named “Wang.” There are at least three other competing explanations, and probably more.

First, recent migrants are more likely to buy houses. I bought a house three years ago. I hadn’t previously bought one in Auckland. I bought it because I had moved to Auckland and I wanted somewhere to live. Consistent with this explanation, people with Korean and Indian names, while not over-represented to the same extent are also more likely to be buying than selling houses, by about the same ratio as Chinese.

Second, it could be that (some subset of) Chinese New Zealanders prefer real estate as an investment to, say, stocks (to an even greater extent than Aucklanders in general).  Third, it could easily be that (some subset of) Chinese New Zealanders have a higher savings rate than other New Zealanders, and so have more money to invest in houses.

Personally, I’d guess that all these explanations are true: that Chinese New Zealanders (on average) buy both homes and investment properties more than other New Zealanders, and that there are foreign property investors of Chinese ethnicity. But that’s a guess: these data don’t tell us — as the Herald explicitly points out.

One of the repeated points I  make on StatsChat is that you need to distinguish between what you measured and what you wanted to measure.  Using ‘Chinese’ as a surrogate for ‘foreign’ will capture many New Zealanders and miss out on many foreigners.

The misclassifications aren’t just unavoidable bad luck, either. If you have a measure of ‘foreign real estate ownership’ that includes my next-door neighbours and excludes James Cameron, you’re doing it wrong, and in a way that has a long and reprehensible political history.

But on top of that, if there is substantial foreign investment and if it is driving up prices, that’s only because of the artificial restrictions on the supply of Auckland houses. If Auckland could get its consent and zoning right, so that more money meant more homes, foreign investment wouldn’t be a problem for people trying to find somewhere to live. That’s a real problem, and it’s one that lies within the power of governments to solve.

July 9, 2015

Interesting graph of the day

From Matt Levine at Bloomberg

nyse

This is a graph of cumulative US stock trades today. The pink circle is centred at 11:32am, when the New York Stock Exchange had technical problems and shut down. Notice how nothing happens: the computers adapt very quickly to having a slightly smaller range of places to trade. As Levine puts it:

“For the most part the system is muddling along, relatively normally,” says a guy, and presumably if you asked a computer it would be even more chill.

June 7, 2015

What does 80% accurate mean?

From Stuff (from the Telegraph)

And the scientists claim they do not even need to carry out a physical examination to predict the risk accurately. Instead, people are questioned about their walking speed, financial situation, previous illnesses, marital status and whether they have had previous illnesses.

Participants can calculate their five-year mortality risk as well as their “Ubble age” – the age at which the average mortality risk in the population is most similar to the estimated risk. Ubble stands for “UK Longevity Explorer” and researchers say the test is 80 per cent accurate.

There are two obvious questions based on this quote: what does it mean for the test to be 80 per cent accurate, and how does “Ubble” stand for “UK Longevity Explorer”? The second question is easier: the data underlying the predictions are from the UK Biobank, so presumably “Ubble” comes from “UK Biobank Longevity Explorer.”

An obvious first guess at the accuracy question would be that the test is 80% right in predicting whether or not you will survive 5 years. That doesn’t fly. First, the test gives a percentage, not a yes/no answer. Second, you can do a lot better than 80% in predicting whether someone will survive 5 years or not just by guessing “yes” for everyone.

The 80% figure doesn’t refer to accuracy in predicting death, it refers to discrimination: the ability to get higher predicted risks for people at higher actual risk. Specifically, it claims that if you pick pairs of  UK residents aged 40-70, one of whom dies in the next five years and the other doesn’t, the one who dies will have a higher predicted risk in 80% of pairs.

So, how does it manage this level of accuracy, and why do simple questions like self-rated health, self-reported walking speed, and car ownership show up instead of weight or cholesterol or blood pressure? Part of the answer is that Ubble is looking only at five-year risk, and only in people under 70. If you’re under 70 and going to die within five years, you’re probably sick already. Asking you about your health or your walking speed turns out to be a good way of finding if you’re sick.

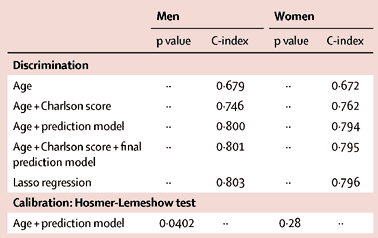
This table from the research paper behind the Ubble shows how well different sorts of information predict.

si2

Age on its own gets you 67% accuracy, and age plus asking about diagnosed serious health conditions (the Charlson score) gets you to 75%.  The prediction model does a bit better, presumably it’s better at picking up a chance of undiagnosed disease.  The usual things doctors nag you about, apart from smoking, aren’t in there because they usually take longer than five years to kill you.

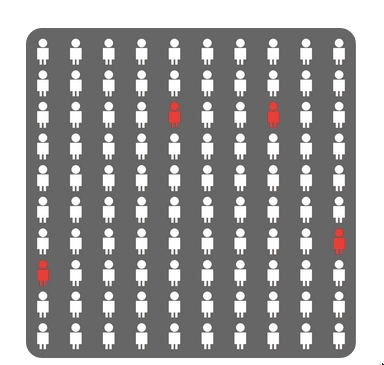
As an illustration of the importance of age and basic health in the prediction, if you put in data for a 60-year old man living with a partner/wife/husband, who smokes but is healthy apart from high blood pressure, the predicted percentage for dying is 4.1%.

The result comes with this well-designed graphic using counts out of 100 rather than fractions, and illustrating the randomness inherent in the prediction by scattering the four little red people across the panel.

ubble

Back to newspaper issues: the Herald also ran a Telegraph story (a rather worse one), but followed it up with a good repost from The Conversation by two of the researchers. None of these stories mentioned that the predictions will be less accurate for New Zealand users. That’s partly because the predictive model is calibrated to life expectancy, general health positivity/negativity, walking speeds, car ownership, and diagnostic patterns in Brits. It’s also because there are three questions on UK government disability support, which in our case we have not got.


May 30, 2015

Coffee health limit exaggerated

The Herald says

Drinking the caffeine equivalent of more than four espressos a day is harmful to health, especially for minors and pregnant women, the European Union food safety agency has said.

“It is the first time that the risks from caffeine from all dietary sources have been assessed at EU level,” the EFSA said, recommending that an adult’s daily caffeine intake remain below 400mg a day.

Deciding a recommended limit was a request of the European Commission, the EU’s executive body, to try to find a Europe-wide benchmark for caffeine consumption.

But regulators said the most worrying aspect was not the espressos and lattes consumed on cafe terraces across Europe, but Red Bull-style energy drinks, hugely popular with the young.

Contrast that with the Scientific Opinion on the safety of caffeine from the EFSA Panel on Dietetic Products, Nutrition, and Allergies (PDF of the whole thing). First, what they were asked for

the EFSA Panel … was asked to deliver a scientific opinion on the safety of caffeine. Advice should be provided on a daily intake of caffeine, from all sources, that does not give rise to concerns about harmful effects to health for the general population and for specific subgroups of the population. Possible interactions between caffeine and other constituents of so-called “energy drinks”, alcohol, synephrine and physical exercise should also be addressed.

and what they concluded (there’s more than 100 pages extra detail if you want it)

Single doses of caffeine up to 200 mg, corresponding to about 3 mg/kg bw for a 70-kg adult are unlikely to induce clinically relevant changes in blood pressure, myocardial blood flow, hydration status or body temperature, to  reduce perceived extertion/effort during exercise or to mask the subjective perception of alcohol intoxication. Daily caffeine intakes from all sources up to 400 mg per day do not raise safety concerns for adults in the general population, except pregnant women. Other common constituents of “energy drinks” (i.e. taurine, D-glucurono-γ- lactone) or alcohol are unlikely to adversely interact with caffeine. The short- and long-term effects of co-consumption of caffeine and synephrine on the cardiovascular system have not been adequately investigated in humans. Daily caffeine intakes from all sources up to 200 mg per day by pregnant women do not raise safety concerns for the fetus. For children and adolescents, the information available is insufficient to base a safe level of caffeine intake. The Panel considers that caffeine intakes of no concern derived for acute consumption in adults (3 mg/kg bw per day) may serve as a basis to derive daily caffeine intakes of no concern for children and adolescents.

Or, in even shorter paraphrase.

<shrugs> If you need a safe level, four cups a day seems pretty harmless in healthy people, and there doesn’t seem to be a special reason to worry about teenagers.


May 28, 2015

Junk food science

In an interesting sting on the world of science journalism, John Bohannon and two colleagues, plus a German medical doctor, ran a small randomised experiment on the effects of chocolate consumption, and found better weight loss in those given chocolate. The experiment was real and the measurements were real, but the medical journal  was the sort that published their paper two weeks after submission, with no changes.

Here’s a dirty little science secret: If you measure a large number of things about a small number of people, you are almost guaranteed to get a “statistically significant” result. Our study included 18 different measurements—weight, cholesterol, sodium, blood protein levels, sleep quality, well-being, etc.—from 15 people. (One subject was dropped.) That study design is a recipe for false positives.

Think of the measurements as lottery tickets. Each one has a small chance of paying off in the form of a “significant” result that we can spin a story around and sell to the media. The more tickets you buy, the more likely you are to win. We didn’t know exactly what would pan out—the headline could have been that chocolate improves sleep or lowers blood pressure—but we knew our chances of getting at least one “statistically significant” result were pretty good.

Bohannon and his conspirators were doing this deliberately, but lots of people do it accidentally. Their study was (deliberately) crappier than average, but since the journalists didn’t ask, that didn’t matter. You should go read the whole thing.

Finally, two answers for obvious concerns: first, the participants were told the research was for a documentary on dieting, not that it was in any sense real scientific research. Second: no, neither Stuff nor the Herald fell for it.

 [Update: Although there was participant consent, there wasn’t ethics committee review. An ethics committee probably wouldn’t have allowed it. Hilda Bastian on Twitter]

May 21, 2015

Fake data in important political-science experiment

Last year, a research paper came out in Science demonstrating an astonishingly successful strategy for gaining support for marriage equality: a short, face-to-face personal conversation with a gay person affected by the issue. As the abstract of the paper said

Can a single conversation change minds on divisive social issues, such as same-sex marriage? A randomized placebo-controlled trial assessed whether gay (n = 22) or straight (n = 19) messengers were effective at encouraging voters (n = 972) to support same-sex marriage and whether attitude change persisted and spread to others in voters’ social networks. The results, measured by an unrelated panel survey, show that both gay and straight canvassers produced large effects initially, but only gay canvassers’ effects persisted in 3-week, 6-week, and 9-month follow-ups. We also find strong evidence of within-household transmission of opinion change, but only in the wake of conversations with gay canvassers. Contact with gay canvassers further caused substantial change in the ratings of gay men and lesbians more generally. These large, persistent, and contagious effects were confirmed by a follow-up experiment. Contact with minorities coupled with discussion of issues pertinent to them is capable of producing a cascade of opinion change.

Today, the research paper is going away again. It looks as though the study wasn’t actually done. The conversations were done: the radio program “This American Life” gave a moving report on them. The survey of the effect, apparently not so much. The firm who were supposed to have done the survey deny it, the organisations supposed to have funded it deny it, the raw data were ‘accidentally deleted’.

This was all brought to light by a group of graduate students who wanted to do a similar experiment themselves. When they looked at the reported data, it looked strange in a lot of ways (PDF). It was of better quality than you’d expect: good response rates, very similar measurements across two cities,  extremely good before-after consistency in the control group. Further investigation showed before-after changes fitting astonishingly well to a Normal distribution, even for an attitude measurement that started off with a huge spike at exactly 50 out of 100. They contacted the senior author on the paper, an eminent and respectable political scientist. He agreed it looked strange, and on further investigation asked for the paper to be retracted. The other author, Michael LaCour, is still denying any fraud and says he plans to present a comprehensive response.

Fake data that matters outside the world of scholarship is more familiar in medicine. A faked clinical trial by Werner Bezwoda led many women to be subjected to ineffective, extremely-high-dose chemotherapy. Scott Reuben invented all the best supporting data for a new approach to pain management; a review paper in the aftermath was titled “Perioperative analgesia: what do we still know?”  Michael LaCour’s contribution, as Kieran Healy describes, is that his approach to reducing prejudice has been used in the Ireland marriage equality campaign. Their referendum is on Friday.