Posts filed under Risk (222)

June 21, 2012

Why Nigeria?

A fairly large fraction of the spam advertising the chance to capitalise on stolen riches is sent by Nigerian criminals.  What should be more surprising is the fact that a lot of the spam actually says it’s from Nigeria (or other West African nations).  Since everyone knows about Nigerian scams, why don’t the spammers claim to be from somewhere else? It’s not as if they have an aversion to lying about other things.

A new paper from Cormac Herley at Microsoft Research has a statistically-interesting explanation:  the largest cost in spam operations is in dealing with the people who respond to the first email.  Some of these people later realise what’s going on and drop out without paying; from the spammer’s point of view these are false positives — they cost time and money to handle, but don’t end up paying off.   A spammer ideally wants only to engage with the most gullible potential victims; the fact that ‘Nigeria’ will spark suspicions in many people is actually a feature, not a bug.


February 5, 2012

Explaining risks

Stuff has an article on home birth, including statistics from the Oz & NZ obstetricians (whose policy is uniform disapproval, in contrast to British obstetricians) showing that home birth is more dangerous for the infant.

Getting a good idea of the risks is not easy:  you don’t want to compare births that end up at home with those that end up in the hospital, since some births at home were planned to be in the hospital, until something went wrong, and some hospital births were planned to be at home, until something went wrong.   You also can’t just compare births where nothing went wrong, since that misses the whole point of risk estimation.  The statistics compare women who planned to give birth at home with those who planned to give birth in the hospital (but didn’t have any special risks that would have prevented a home birth).  That’s the closest you can get to a fair comparison, though it’s obviously not perfect.    In general, people who tend to do what their doctors want also tend to be healthier — even if what their doctors are telling them isn’t actually helpful — and we know that obstetricians want women to give birth in hospital.  You could also think of biases in the other direction if you spend a few minutes on it.

However, if the numbers are more or less correct, there’s still the question of how to present them.  The obstetricians say the rate of neonatal death was almost three times higher for the women in the studies who planned to have a home birth.  The article in Stuff points out that this is 0.15% vs 0.04%, so the absolute risk is small.  A better way to present numbers like this is in terms of deaths per 10,000 births. Although the information is the same, there’s a surprisingly large amount of evidence that people understand counts better than proportions, especially small proportions.  So: 10,000 pregnant women similar to those in the studies would have about 15 neonatal deaths if they all planned a home birth and about 4 neonatal deaths if they all planned a hospital birth. For context, 10,000 births is all Auckland births for about five months, or all Wellington births for about 18 months.
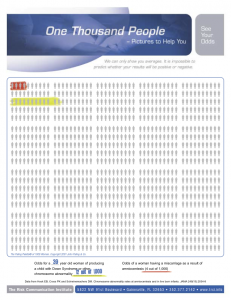
It’s even better to present this sort of information in visual form, using something like the Paling Palettes from the Risk Communication Institute.  These allow you to see both absolute and relative risks easily.  The example on the left is from their website, and is a pregnancy-related example.  On the background of 1000 people are two colored risks. The red is the risk of miscarriage from amniocentesis; the green is the risk of Down Syndrome in a child of a 39-year-old woman.

[Updated to add:  of course, you should do the same thing with the various reduced risks for the mothers — the 10,000 planned home births would also prevent nearly 1500 cases of vaginal laceration, about 130 of them serious (3rd degree)]


January 20, 2012

Predicting whether you’ll live to 100.

From the Herald

Scientists are claiming a genetic test can predict whether someone will live to 100 years old.

The study…claims to be able to predict exceptional longevity with 60 to 85 percent accuracy, depending on the subject’s age.

You can read the paper, which is in the open-access journal PLoS One.

Whether the prediction really works comes down in part to what you mean by “60 to 85% accuracy”.  There’s a very easy way to predict whether someone will live to 100 years old, with better than 99% accuracy.  Ask them if they are over 100. If they say “Yes”, predict “Yes”; if they say “No”, predict “No”.  Since almost no-one lives to be 100 you will almost always be right.

The new test is not as useless as this, but it still isn’t terribly accurate.  Distinguishing people who live to 90 from those who live to 100, the test gets the correct prediction for about  half of the centenarians and for about two-thirds of the non-centenarians.  You could probably predict that well in 90+ year olds by asking them how their health is, and whether they can get around on their own.  The ability to predict survival to 105 among 100-year-olds is slightly better, but again, probably not as accurate as you could get more easily from health information.  The point of the paper isn’t really prediction. It’s to find genes that are connected with longevity, which are still not well understood, and the reason for talking about prediction is to make the point that genetic variations do matter in extreme old age.  Even from this point of view the results are a bit over-sold, since the biggest component of the genetics is a well-known gene, APO E, where commercial testing has been (controversially) available for years.

This study has attracted a lot of media attention around the world. Some stories mentioned this note from the journal editors:

While we recognize that aspects of this study will attract attention owing to the history and the strong claims made in the paper, the handling editor, Greg Gibson, made the decision that publication is warranted, balancing the extensive peer review and the spirit of PLoS ONE to allow important new results and approaches to be available to the scientific community so long as scientific standards have been met.  We trust that publication will facilitate full evaluation of the study.

Others didn’t.

November 24, 2011

Interactive map of US road deaths

Zoom in anywhere in the US and see the locations, with icons indicating year and who died.

They also have a UK map, and are interested in expanding to other countries where the data are available.

September 22, 2011

Death by toaster or death by terrorism?

Which do you think is more likely to kill you? A toaster or Islamic extremist terrorism? The answer may surprise you.

Security guru Bruce Schneier has written a piece entitled Terrorism in the U.S. Since 9/11. As a critic of the excesses of the United States of America’s response to the events of September 11, 2001, Schneier compares the spending on anti-terrorism with the number of lives saved.

In my opinion, the most interesting part was where he refers to a Comparison of Annual Fatality Risks published deep inside Hardly Existential: Terrorism as a Hazard to Human Life by John Mueller and Mark G. Stewart:

You have a 1 in 1,500,000 chance of being killed by a home appliance every year in the United States, but only a 1 in 3,500,000 chance of being killed by terrorism.

September 14, 2011

Reefer madness

The factoid of dramatically increasing cannabis potency has popped up again, with a claim that cannabis used to be 1-2% THC and is now up to 33%.    The most comprehensive and consistent data on cannabis potency come from a long-term project at the University of Mississippi. Their 2010 paper is based on analysis of 46,000 confiscated samples from 1993 to 2008.    Over this time period, the percentage of THC in marijuana (leaves and buds with seeds) increased from about 3.5% to about 6%.  The percentage in sinsemilla (buds without seeds) increased from about 6% to about 11%.   Since the more-recent samples were more likely to be sinsemilla, the percentage over all confiscated samples increased a bit more, from about 3.5% to about 9%.  A small fraction of the samples had much higher concentrations, but this fraction didn’t change much over time. So, yes, the average used to be about 3% in 1993 and may have been as low as 2% in earlier decades, and, yes, the concentration is now ‘up to‘ 33%, but the trend is nothing like as strong as that suggests.   A New Zealand paper , by ESR researchers (who are hardly pot-sympathising hippies), says that there was no real change in THC concentration in cannabis plant material from 1976 to 1996, and the concentration in cannabis oil actually fell.

The Southland Times article also reports a claim that 90% of first-term methamphetamine users continue to use the drug. If this just means that 90% of them go on to have a second dose at some time it might well be true, but if it is implying long-term addiction the figure seems implausible. It’s certainly not what is found in other countries.  For example, the most recent results from the US National Survey on Drug Use and Health (NSDUH) estimate that 364000 people in the US had dependence/abuse of illegal stimulants in 2010. If we assume that all of these were methamphetamine, and that the other illegal stimulants didn’t cause any dependence/abuse problems, that’s still only 20% of the estimated 1.8 million people who first tried methamphetamine in the period 2002-2010. In fact, since NSDUH has a nice online table generator we can do a more specialized query and find out that an estimated 118000 people currently had dependence on stimulants out of the estimated 10 million people who had ever tried methamphetamine. That’s more like 1% than 90%.   Amphetamines are clearly something you want to stay well away from, but there’s no way that they addict 90% of the people who try them. In any case, if we believe the drug warriors, New Zealand’s P epidemic has already been solved by banning pseudoephedrine without a prescription.

I’m all for getting teenagers to appreciate the risks of drug use, but we need to remember teenagers can use Google too.


August 26, 2011

Visualizing uncertainty

Hurricane Irene is heading for somewhere on the US East Coast, though it’s not clear where.  Weather Underground has a nice range of displays indicating the uncertainty in predictions of both location and storm intensity.

August 25, 2011

Extreme weather

No, not last week’s snow.  To paraphrase Crocodile Dundee: “That’s not an extreme weather event! This is an extreme weather event.” The graph below shows daily deaths in Chicago, over a fourteen year period.  Do you notice anything?

(more…)

June 20, 2011

The Big Risk Test – BBC Lab UK

What sort of risk taker are you and why do you take the risks you do? You can find out more by participating in what aims to be the biggest ever study of the science of risk.

The Big Risk Test, developed by academics at the University of Cambridge, aims to be the biggest study of risk ever undertaken. Professor David Spiegelhalter and Dr Mike Aitken explain what the test is about and what they hope it will reveal here.

Take the test here.

June 17, 2011

Reporting of health risks in the media

New research published in the journal Public Understanding of Science from a group of British researchers including Ben Goldacre of Bad Science has found that misreporting of dietary advice by UK newspapers is widespread and may contribute to public misconceptions about food and health.

The authors took the Top 10 bestselling UK newspapers for a week and evaluated the evidence for every single health claim reported on using the best currently available published research. Each claim was graded using two standard systems for categorising the strength of evidence.

They found 111 health claims were made in those UK newspapers over one week and in only 15% of those claims the evidence was “convincing”.

For more details and limitations on the study, see this Guardian article by Ben Goldacre in which he concludes:

It seems that the majority of health claims made, in a large representative sample of UK national newspapers, are supported only by the weakest possible forms of evidence.

People who work in public health bend over backwards to disseminate evidence-based information to the public. I wonder if they should also focus on documenting and addressing the harm done by journalists.