Posts filed under Risk (222)

April 11, 2013

Power failure threatens neuroscience

A new research paper with the cheeky title “Power failure: why small sample size undermines the reliability of neuroscience” has come out in a neuroscience journal. The basic idea isn’t novel, but it’s one of these statistical points that makes your life more difficult (if more productive) when you understand it.  Small research studies, as everyone knows, are less likely to detect differences between groups.  What is less widely appreciated is that even if a small study sees a difference between groups, it’s more likely not to be real.

The ‘power’ of a statistical test is the probability that you will detect a difference if there really is a difference of the size you are looking for.  If the power is 90%, say, then you are pretty sure to see a difference if there is one, and based on standard statistical techniques, pretty sure not to see a difference if there isn’t one. Either way, the results are informative.

Often you can’t afford to do a study with 90% power given the current funding system. If you do a study with low power, and the difference you are looking for really is there, you still have to be pretty lucky to see it — the data have to, by chance, be more favorable to your hypothesis than they should be.   But if you’re relying on the  data being more favorable to your hypothesis than they should be, you can see a difference even if there isn’t one there.

Combine this with publication bias: if you find what you are looking for, you get enthusiastic and send it off to high-impact research journals.  If you don’t see anything, you won’t be as enthusiastic, and the results might well not be published.  After all, who is going to want to look at a study that couldn’t have found anything, and didn’t.  The result is that we get lots of exciting neuroscience news, often with very pretty pictures, that isn’t true.

The same is true for nutrition: I have a student doing a Honours project looking at replicability (in a large survey database) of the sort of nutrition and health stories that make it to the local papers. So far, as you’d expect, the associations are a lot weaker when you look in a separate data set.

Clinical trials went through this problem a while ago, and while they often have lower power than one would ideally like, there’s at least no way you’re going to run a clinical trial in the modern world without explicitly working out the power.

Other people’s reactions
March 29, 2013

Unclear on the concept: average time to event

One of our current Stat of the Week nominations is a story on Stuff claiming that criminals sentenced to preventive detention are being freed after an average of ‘only’ 11 years.

There’s a widely-linked story in the Guardian claiming that the average time until Google kills new services is 1459 days, based on services that have been cancelled in the past.  The story even goes on to say that more recent services have been cancelled more quickly.

As far as I know, no-one has yet produced a headline saying that the average life expectancy  for people born in the 21st century is only about 5 years, but the error in reasoning would be the same.

In all three cases, we’re interested in the average time until some event happens, but our data are incomplete, because the event hasn’t happened for everyone.  Some Google services are still running; some preventive-detention cases are still in prison; some people born this century are still alive.  A little thought reveals that the events which have occurred are a biased sample: they are likely to be the earliest events.   The 21st century kids who will live to 90 are still alive; those who have already died are not representative.

In medical statistics, the proper handling of times to death, to recurrence, or to recovery is a routine problem.  It’s still not possible to learn as much as you’d like without assumptions that are often unreasonable. The most powerful assumption you can make is that the rate of events is constant over time, in which case the life expectancy is the total observed time divided by the total number of events — you need to count all the observed time, even for the events that haven’t happened yet.  That is, to estimate the survival time for Google services, you add up all the time that all the Google services have operated, and divide by the number that have been cancelled.  People in the cricket-playing world will recognise this as the computation used for batting averages: total number of runs scored, divided by total number of times out.

The simple estimator is often biased, since the risk of an event may increase or decrease with time.  A new Google service might be more at risk than an established one; a prisoner detained for many years might be less likely to be released than a more recent convict.  Even so, using it distinguishes people who have paid some attention to the survivors from those who haven’t.

I can’t be bothered chasing down the history of all the Google services, but if we add in search (from 1997),  Adwords (from 2000), image search (2001), news (2002),  Maps, Analytics, Scholar, Talk, and Transit (2005), and count Gmail only from when it became open to all in 2007, we increase the estimated life expectancy for a Google service from the 4 years quoted in the Guardian to about 6.5 years.  Adding in other still-live services can only increase this number.

For a serious question such as the distribution of time in preventive detention you would need to consider trends over time, and differences between criminals, and the simple constant-rate model would not be appropriate.  You’d need a bit more data, unless what you wanted was just a headline.

March 27, 2013

Sensor data and the monitored life

The Herald’s has two good stories recently (and other outlets are similar) about new data collection and analysis with smartphone apps.   If you read the stories carefully there’s been an outbreak of synecdoche in the newsroom — they are actually stories about new sensors that collect data, and smartphone apps that can be used to monitor the sensors — but that’s a minor detail.

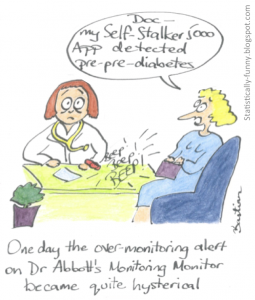
As sensors based on electronics and micromechanics become cheap, it’s easy to collect more and more data.  This can be valuable — measuring blood glucose, or pollutants in the air — but it can also get out of hand.  Epidemiologist Hilda Bastian gives us this cartoon of the “Self-Stalker 5000” and writes about evidence-based monitoring in her blog at Scientific American

Self-Stalker-5000


and Nick Alex Harrowell points out

The stereotype application could be defined as “bugging granny”. We’re going to check some metrics at intervals, stick them into a control chart, and then badger you about it.

To be fair, he’s worrying most about sensors that don’t send to a smartphone app, but many of the same principles apply.

March 26, 2013

Salience bias

There’s been a lot of news recently about cold weather and snow in parts of the far Northern hemisphere that have  people living in them, especially English-speaking people.   As has typically happened with newsworthy cold snaps in recent years, this is balanced by unseasonably warm weather in parts of the far North that don’t have many  people living in them.

33


There are good reasons why the TV news doesn’t have much coverage of unseasonably warm weather in northern Greenland and the Arctic icecap. For a start, the local broadcasting infrastructure sucks.  It’s still important to remember that we only hear about weather in a fairly small fraction of the world.

March 17, 2013

Briefly

  • When data gets more important, there’s more incentive to fudge it.  From the Telegraph: ” senior NHS managers and hospital trusts will be held criminally liable if they manipulate figures on waiting times or death rates.”
  • A new registry for people with rare genetic diseases, emphasizing the ability to customise what information is revealed and to whom.
  • Wall St Journal piece on Big Data. Some concrete examples, not just the usual buzzwords
  • Interesting visualisations from RevDanCat
March 10, 2013

Bad news, good graphic

From NIWA, soil moisture across the country (via @nzben on Twitter), compared to the same time last year and to the average for this date.

smd_map


Update: If I had to be picky about something: that light blue colour. It doesn’t really fit in the sequence.

Update: Stuff also has a NIWA map, and theirs looks worse, but it’s based on rainfall over just the past three weeks (and, strangely, labelled “Drought levels over the past six days”)

March 3, 2013

Keep calm and ignore tail risk

Consider a problem in statistical decision theory.

Suppose you can create a t-shirt slogan at zero cost, and submit it for market testing.  If it’s popular, you make money; if it isn’t popular, you pay nothing.  It’s easy to see that you should submit as many t-shirt designs as you can generate: there’s no downside, and the upside might be good.

The problem is that you might create slogans that are sufficiently offensive to get the whole world mad at you.  And if you create more than half a million t-shirt slogans, it’s not all that unlikely that some of them will be really, really, really bad. And it’s not a convincing defense to say that the computer did it, and you didn’t bother checking the results.

February 15, 2013

There oughtta be a law

David Farrar (among others) has written about a recent Coroner’s recommendation that high-visibility clothing should be compulsory for cyclists.  As he notes, ” if you are cycling at night you are a special sort of moron if you do not wear hi-vis gear”, but he rightly points out that isn’t the whole issue.

It’s easy to analyse a proposed law as if the only changes that result are those the law intends: everyone will cycle the same way, but they will all be wearing lurid chartreuse studded with flashing lights and will live happily ever after.  But safety laws, like other public-health interventions, need to be assessed on what will actually happen.

Bicycle helmet laws are a standard example.  There is overwhelming evidence that wearing a bicycle helmet reduces the risk of brain injury, but there’s also pretty good evidence that requiring bicycle helmets reduces cycling. Reducing the number of cyclists is bad from an individual-health point of view and also makes cycling less safe for those who remain. It’s not obvious how to optimise this tradeoff, but my guess based on no evidence is that pro-helmet propaganda might be better than helmet laws.

Another example was a proposal by some US airlines to require small children to have their own seat rather than flying in a parent’s lap. It’s clear that having their own seat is safer, but also much more expensive.  If any noticeable fraction of these families ended up driving rather than flying because of the extra cost, the extra deaths on the road would far outweigh those saved in the air.

It’s hard to predict the exact side-effects of a law, but that doesn’t mean they can be ignored any more than the exact side-effects of new medications can be ignored. The problem is that no-one will admit they don’t know the effects of a proposed law.  It took us decades to persuade physicians that they don’t magically know the effects of new treatments; let’s hope it doesn’t take much longer in the policy world.

[PS: yes, I do wear a helmet when cycling, except in the Netherlands, where bikes rule]

February 5, 2013

A quick tongue-in-cheek checklist for assessing usefulness of media stories on risk

Do you shout at the morning radio when a story about a medical “risk” is distorted, exaggerated, mangled out of all recognition? You are not alone. Kevin McConway and David Spiegelhalter, writing in Significance, a quarterly magazine published by the Royal Statistical Society, have come up with a checklist for scoring media stories about medical risks. Their mnemonic checklist comprises 12 items and is called the ‘John Humphrys’ scale, said Mr Humphrys being a well-known UK radio and television presenter.

Capture

They assign one point for every ‘yes’ and do a test on a story about magnetic fields and asthma, and another about TV and length of life. The article, called Score and Ignore: A radio listener’s guide to ignoring health stories, is here.

Could form the basis of a useful classroom resource.

January 27, 2013

Clinical trials in India

Stuff has a story from the Sydney Morning Herald on clinical trials in India.  The basic claims are damning if true:

…clinical drug trials are at the centre of a growing controversy in India, as evidence emerges before courts and, in government inquiries, of patients being put onto drug trials without their knowledge or consent…

With a very few exceptions (eg some trials of emergency resuscitation techniques and some minimal-risk cluster-randomised trials of treatment delivery)  it is absolutely fundamental that trial participants give informed consent. Trial protocols are supposed to be reviewed in advance to make sure that participants aren’t asked to consent to unreasonably things, but consent is still primary.  This isn’t just a technical detail, since researchers who were unclear on the importance of consent have often been bad at other aspects of research or patient care.

The Fairfax story mixes in the claimed lack of consent with other claims that are either less serious or not explained clearly. For example

Figures from the drugs controller- general show that in 2011 there were deaths during clinical trials conducted by, or on behalf of, Novartis, Quintiles, Pfizer, Bayer, Bristol Mayer Squibb, and MSD Pharmaceutical.

Of course there were deaths in clinical trials. If you are comparing two treatments for a serious illness, the trial participants will be seriously ill.  When you need to know if a new treatment reduces the risk of death, the only way to tell is to do a study large enough that some people are expected to die.  Even if improved survival isn’t directly what you’re measuring, a large trial will include people who die. In the main Women’s Health Initiative hormone replacement trial, for example, 449 women had died by the time the trial was stopped.  The question isn’t whether there were deaths, it’s whether there were deaths that wouldn’t have occurred if the trials had been done right.

There’s also a claim that families of participants who died were not given adequate compensation as part of the trial.  If there had been consent, this wouldn’t necessarily matter. Lots of trials in developed countries don’t specifically compensate participants or relatives, and there’s actually some suspicion of those that do, because it provides another incentive to participate even if you don’t really want to.

Other sources: Times of India, Chemistry World, a couple of review articles, the Nuremberg Code