Posts filed under Risk (222)

November 19, 2013

Briefly

  • Animated visualisation of motor vehicle accident rates over the year in Australia. Unfortunately it’s based on just one year of data, which isn’t really enough. And if you’re going the effort of the animation, it would have been nice to use it to illustrate uncertainty/variability in the data
  • Randomised trials outside medicine: the combined results of ten trials of restorative justice conferences. Reoffending over the next two years was reduced, and the victims were happier with the handling of the case. (via @hildabast)
  • How much do @nytimes tweets affect pageviews for their stories?
October 27, 2013

What you do know that ain’t so

In 2006, statistics celebrity Hans Rosling asked students at the Karolinska Insitute about international child mortality. In each of the following pairs of countries (presented in alphabetical order within pairs), which one has higher child mortality?

  • Sri Lanka or Turkey?
  • Poland or South Korea?
  • Malaysia or Russia?
  • Pakistan or Vietnam?
  • South Africa or Thailand

None of these are close — they differ by at least a factor of two — but the students did significantly worse than chance, averaging less than two correct answers out of five.

Gapminder.org has a new ‘Ignorance Project’ aiming to find out what important facts about global health and welfare are widely misunderstood.  They don’t just have a naive ‘information deficiency’ view of this ignorance:

When we encounter ignorance, we want to find a cure. Sometimes the facts just have to be delivered. But in many cases, the facts are little known as they don’t fit with other misunderstandings, they are counterintuitive, such as the most of the outdated concepts about the world population. In these cases we need to invent a new simple way to explain it. Those new explanations are the essence of Gapminder’s new free teaching material that make it fun and easy to teach and to learn a fact-based worldview.

It may not work, but it’s worth a try

(more…)

October 18, 2013

Cost-effectivness and meningococcal vaccine

There’s a story in the Herald arguing for mass vaccination in NZ against group C meningococcal disease.  There’s a good case for the vaccination — it’s a really nasty disease and there aren’t any other good treatment or prevention approaches — but I don’t see how the cost-effectiveness claims in the story can be right.

Dr Gravatt is quoted as saying there would be zero net medical cost for the vaccination program

Dr Gravatt estimated the net cost of vaccinating children at 12 months and again at 18 years would be zero for each “quality-adjusted” year of life saved at a vaccine price of $25 to $40 per dose. The listed prices were around $43 to $87, but discounts would be likely in a bulk contract.

He refers to a British vaccine study — which one isn’t specified.  However, there are cost-effectiveness analyses of the whole British group C meningococcal vaccination program (they vaccinate against group C but not group B, the opposite of NZ).  One, from 2002, estimates  a cost per life year saved of £6259. The second, from 2006, considers a wider range of possible vaccination programs: for the one that’s most similar to what Dr Gravatt proposed it estimates net medical costs of £9082 per quality-adjusted life year, and for the cheapest one, £3653 £2760 (update)per quality-adjusted life year. And that’s assuming the vaccine costs only £12 per dose, and in a country where group C meningococcal disease was slightly more common than it is here.

Another way to look at it: there are about 60000 births per year in NZ, so after the initial catch-up phase we’d be paying for 120000 doses per year. Even at $25 per dose, that comes to $3 million per year. According to the Herald’s story there are about 25 cases per year, so for the vaccination to be cost-neutral even at this lowest suggested price, the average disease case would have to cost the healthcare system $120000. That’s more than ten times what the UK cost-effectiveness study estimated (roughly £4000) including both the immediate cost of treating the disease and the cost of treating the long-term effects.

The vaccine looks to be a lot more cost-effective than, say, the prostate cancer drug that Campbell Live was pushing last week, and because herd immunity is important for this disease, there’s a relatively stronger case for vaccinating everyone, but that would be because the cost is worth it, not because the cost is zero.

Updates, including a lot more technical detail:  (more…)
October 8, 2013

Death rate bounce coming?

A good story in Stuff today about mortality rates.

A Ministry of Health report shows while death rates are as low as they have even been since mortality data was collected, men are far more likely to die of preventable causes than women.

Heart Foundation medical director Professor Norman Sharpe said it is a gap that will continue to widen as a “new wave” of health problems caused by obesity start showing up in the statistics.

The latest mortality data, gathered from death certificates and post-mortem examinations, shows there were 28,641 deaths registered in New Zealand in 2010.

While the number of actual deaths is increasing, up 8 per cent since 1990, this was because of a growing and ageing population.

Death rates overall have dipped about 35 per cent, meaning statistically we are more likely to survive to a ripe old age.

There aren’t any of the problems I complained about in last year’s story on this topic: there’s a clear distinction between increases in rates and the impact of population size and aging, and the story admits that the problems with preventable deaths it raises are projections for the future.

While on this topic, I will point out a useful technical distinction between rates and risks.  Risks are probabilities; they don’t have any units and are at most 100%. Lifetime risks of death are exactly 100%, and are neither increasing nor decreasing.  Rates are probabilities for an interval of time; they do have units (eg % per year). Rates of death can increase or decrease, as the one death per customer is spread out over shorter or longer periods of time.

October 3, 2013

People who bought this theory also liked…

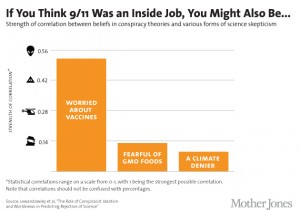
An improved version of study that Stuff and StatsChat reported on more than a year ago has now appeared in print. The study found that people who have non-standard beliefs about the moon landings or Princess Diana’s death are also likely to have non-standard beliefs about climate change or health effects of tobacco. It improves on the previous research by using a reasonably representative online survey rather than a sample of visitors to climate debate blogs.

Mother Jones magazine in the US summarised some of the results in this graph of correlations

conspiracies6_2


That’s a horrible graph partly because, contrary to what the footnote says, correlations are not in fact restricted to be between 0 and 1, but between -1 and 1: and in fact the three correlations shown were negative in the research and have been turned around for more convenient display.

The title is misleading: only one of the six `conspiracist ideation’ questions was about 9/11, and it wasn’t a yes/no question, and it wasn’t really about it being an inside job (ie, performed by the government), but about the government allowing it to happen. In the same way, the other three variables aren’t simple yes/no questions, but scores based multiple questions, each on a 5-point scale.

A more-technical point is that correlations, while appropriate in the paper as part of their statistical model, aren’t really a good way to describe the strength of association.  It’s easier to understand the square of the correlation, which gives the proportion of variability in one variable explained by the other.  That is, the conspiracy-theory score explains about 25% of the variation in the vaccine score,  just over 1% of the variation in the GM Foods score, and just under 1% of the variation in the climate change score.

(via @zentree)

September 28, 2013

Gambling at 19-1

The IPCC report is out. We know the earth has been getting hotter: that’s just simple data analysis. The report says

It is extremely likely that more than half of the observed increase in global average surface temperature from 1951 to 2010 was caused by the anthropogenic increase in greenhouse gas concentrations and other anthropogenic forcings together. The best estimate of the human induced contribution to warming is similar to the observed warming over this period. 

Here, “extremely likely” is defined as 95-100% confidence. Since we (fortunately) don’t get a long series of potential climate catastrophes to average over, the probabilities have to be interpreted in terms of (reasonable) degrees of belief rather than relative frequency, which can be made concrete by equivalents to investment or gambling.

That is, the panel concludes no-one should be betting against a human cause for climate change unless they get better than 19-1 odds (and possibly much better, depending on where in the 95-100% range they are).  Suppose we have an opportunity to reduce greenhouse gas concentrations, which will cost $20 million, and that the money is completely wasted if the climate models are basically wrong, but which will bring in $21 million, for a $1 million profit, if the models are basically right. The evaluation as “extremely likely” means we should take these opportunities.  Investments that have, say, a net loss of $10 million if there isn’t anthropogenic warming and a net saving of $1 million if there is, are very good value.  For mitigation efforts, the odds are even more favourable: the world unquestionably has been warming, so mitigation is likely to be worthwhile even if the reason isn’t CO2.

I don’t think current policies are anywhere near the 19-1 threshold. I’d be surprised if a lot of them even made sense  if the climate was offering even money.


September 27, 2013

How many deaths would be prevented by lowering the blood alcohol limit to 0.08%?

Well, obviously, none. The limit is already 0.08%.

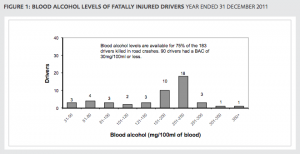
However, there are still deaths caused by people who drive over the limit.  From crash data for drivers only, in 2011, there were a lot more crashes where the driver was above 0.08% than between 0.05% and 0.08%, and a larger fraction of these will have been caused by alcohol rather than just being coincident with alcohol.

bac


Just as lowering the limit 0.08% prevented some, but not all, crashes where the drivers were above 0.08%, lowering the limit to 0.05% would prevent some, but not all, crashes where the driver is above 0.05%.

The Herald says

Alcohol Healthwatch director Rebecca Williams said the statistics clearly showed 20 people would still be alive if the Government had responded to calls for a lower alcohol limit.

which seems completely indefensible.

I don’t have any personal stake in the 0.08% limit — I don’t have a car and can afford taxis. And I’m not denying the real dangers of drink driving: according to estimates from NZ data the risk at 0.08% is about three times that at 0.05%.  But it’s dishonest to assume that all deaths where the driver was over 0.05% would be eliminated by the change, and to pretend there are no costs from the change.  We should be arguing this using the best available estimates of the benefits and costs.

And if you think the costs are irrelevant because there’s no limit on the value of a life, what about all the other ways to save lives? There are plenty of competing options, even if you think it’s only New Zealand lives that are valuable.


September 25, 2013

Briefly

  • Big Data and Due Process: fairly readable academic paper arguing for legal protections against harm done by automated classification (accurate or inaccurate)
  • The Herald quotes Maurice Williamson on a drug seizure operation

“The harm prevented from keeping these analogues away from communities has been calculated at $32 million,” Mr Williamson said.

Back in 2008, Russell Brown explained where these numbers come from. As you might expect, there is no reasonable sense in which they are estimates of harm prevented. They don’t measure what communities should care about.

  • Levels of statistical evidence are ending up in the US Supreme court. At issue is whether  a press release claiming that a treatment”Reduces Mortality by 70% in Patients with Mild to Moderate Disease” is fraud when the study wasn’t set up to look at mortality and when the reduction wasn’t statistically significant by usual standards.  Since a subsequent trial designed to look at mortality reductions convincingly failed to find them, the conclusion implied by the press release title is untrue, but the legal argument is whether, at the time, it was fraud.
  • From New Scientist: is ‘personalised’ medicine actually bad for public health?


September 13, 2013

How dangerous are weddings?

According to the Herald, the ACC wants us to be careful about weddings — about getting injured at them, that is.

Weddings are supposed to be the happiest day of your life – try telling that to the hundreds of people who make ACC claims for injuries at ceremonies.

From tripping on the bride’s dress to swallowing the ring, nuptials can be surprisingly hazardous.

New figures show at least 600 people made claims to the ACC between 2010 and 2012.

So, how does the 600 claims over three years compare to what you’d expect from an average day?

The ACC accepted 1.7 million new claims last year, which gives about 0.4 claims per person per year, or about 0.001 per person per day.

There were about 20 000 marriages in New Zealand last year, so about 60 000 over 2010-2012, giving about 0.01 ACC claims per marriage.  The 600 reported claims would then be about what you’d expect if there were 10 person-days of exposure per marriage.

My experience is that wedding celebrations typically involve more than ten people, and, with setup and rehearsals, often more than one day.  It looks as though weddings, like Christmas, are actually safer than ordinary days.

August 26, 2013

Change and decay in all around I see

There’s an op-ed piece in the New York Times (by a physicist, Adam Frank) about how no-one pays attention to science any more, and it’s all political, with creationism and climate change denial as the main examples.

Chad Orzel (also a physicist) is unconvinced

 [T]he question is whether we’ve fallen off from some golden age when everybody listened raptly to the best science had to offer…. After all, as depressing as it may be for forty-odd percent of the population to want to align themselves with a creationist position (whether from honest belief or out of tribal identification), that’s probably an improvement from the days of the actual Scopes trial. Which, it should be noted, Scopes lost, unlike the several more recent cases where teaching of creationism has been soundly rejected by the courts.

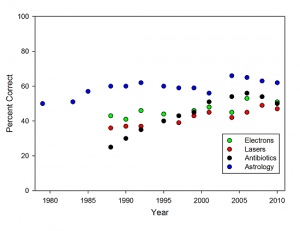
 He points to other questions whether there hasn’t been as much political propaganda and where basic scientific knowledge is improving.

noncontroversial


Again, there’s plenty that’s bad, I’m not going to deny it. But just because we’re not winning as fast as we’d like doesn’t mean that we’re in decline. Though frustration might make it seem that way at times.