Posts filed under Risk (222)

May 25, 2018

Does bacon prevent cancer?

No.

This isn’t even supposed to be new research: it’s just a new set of guidelines based on all the same existing research. Since it’s a new set of public guidelines, you’d think a link would be appropriate: here it is.

The story says “”No level of intake” of processed meats will reduce cancer risks.”  and the quote from the report is The data show that no level of intake can confidently be associated with a lack of risk.  I don’t think that will surprise many people, and it’s what we’ve been told for a long time. There isn’t a magic threshold where bacon switches from being a health food to being bad for you. If you want something more quantitative, the figures we had last bacon panic haven’t changed: eating an extra serving of bacon every day is estimated to increase your lifetime bowel cancer risk by a factor of 1.2, or a bit under two extra cases per hundred people.

For alcohol, the focus on cancer is a bit misleading.  Low levels of alcohol consumption increase cancer risk but reduce heart disease risk, and there’s a range where it’s pretty much a wash — there isn’t a ‘safe level’ from a cancer viewpoint, but there probably is from a not-dying viewpoint. Still, there are lots of people who’d be healthier if they drank less alcohol — and that’s probably not the first time they’ve heard the message.

February 17, 2018

Read me first?

There’s a viral story that viral stories are shared by people who don’t actually read them. I saw it again today in a tweet from Newseum Insititute

If you search for the study it doesn’t take long to start suspecting that the majority of news sources sharing this study didn’t read it first.  One that at least links is from the Independent, in June 2016.

The research paper is here. The money quote looks like this, from section 3.3

First, 59% of the shared URLs are never clicked or, as we call them, silent.

We can expand this quotation slightly

First, 59% of the shared URLs are never clicked or, as we call them, silent. Note that we merged URLs pointing to the same article, so out of 10 articles mentioned on Twitter, 6 typically on niche topics are never clicked

That’s starting to sound a bit different. And more complicated.

What the researchers did was to look at bit.ly URLs to news stories from five major sources, and see if they had ever been clicked. They divided the links into two groups: primary URLs tweeted by the media source itself (eg @NYTimes), and secondary URLs tweeted by anyone else. The primary URLs were always clicked at least once — you’d expect that just for checking purposes.  The secondary URLs, as you’d expect, averaged fewer clicks per tweet; 59% were not clicked at all.

That’s being interpreted as if it were 59% of retweets didn’t involve any clicks. But it isn’t. It’s quite likely that most of these links were never retweeted.  And there’s nothing in the data about whether the person who first tweeted the link read the story: there certainly isn’t any suggestion that person didn’t read the story.

So, if I read some annoying story about near-Earth asteroids on the Herald and if tweeted a bit.ly URL, there’s a chance no-one would click on it. And, looking at my Twitter analytics, I can see that does sometimes happen. When it happens, people usually don’t retweet the link either, and it definitely doesn’t go viral.

If I retweeted the official @NZHerald link about the story, then it would almost certainly have been clicked by someone. The research would say nothing whatsoever about the chance that I (or any of the other retweeters) had read it.


February 16, 2018

Best places to retire?

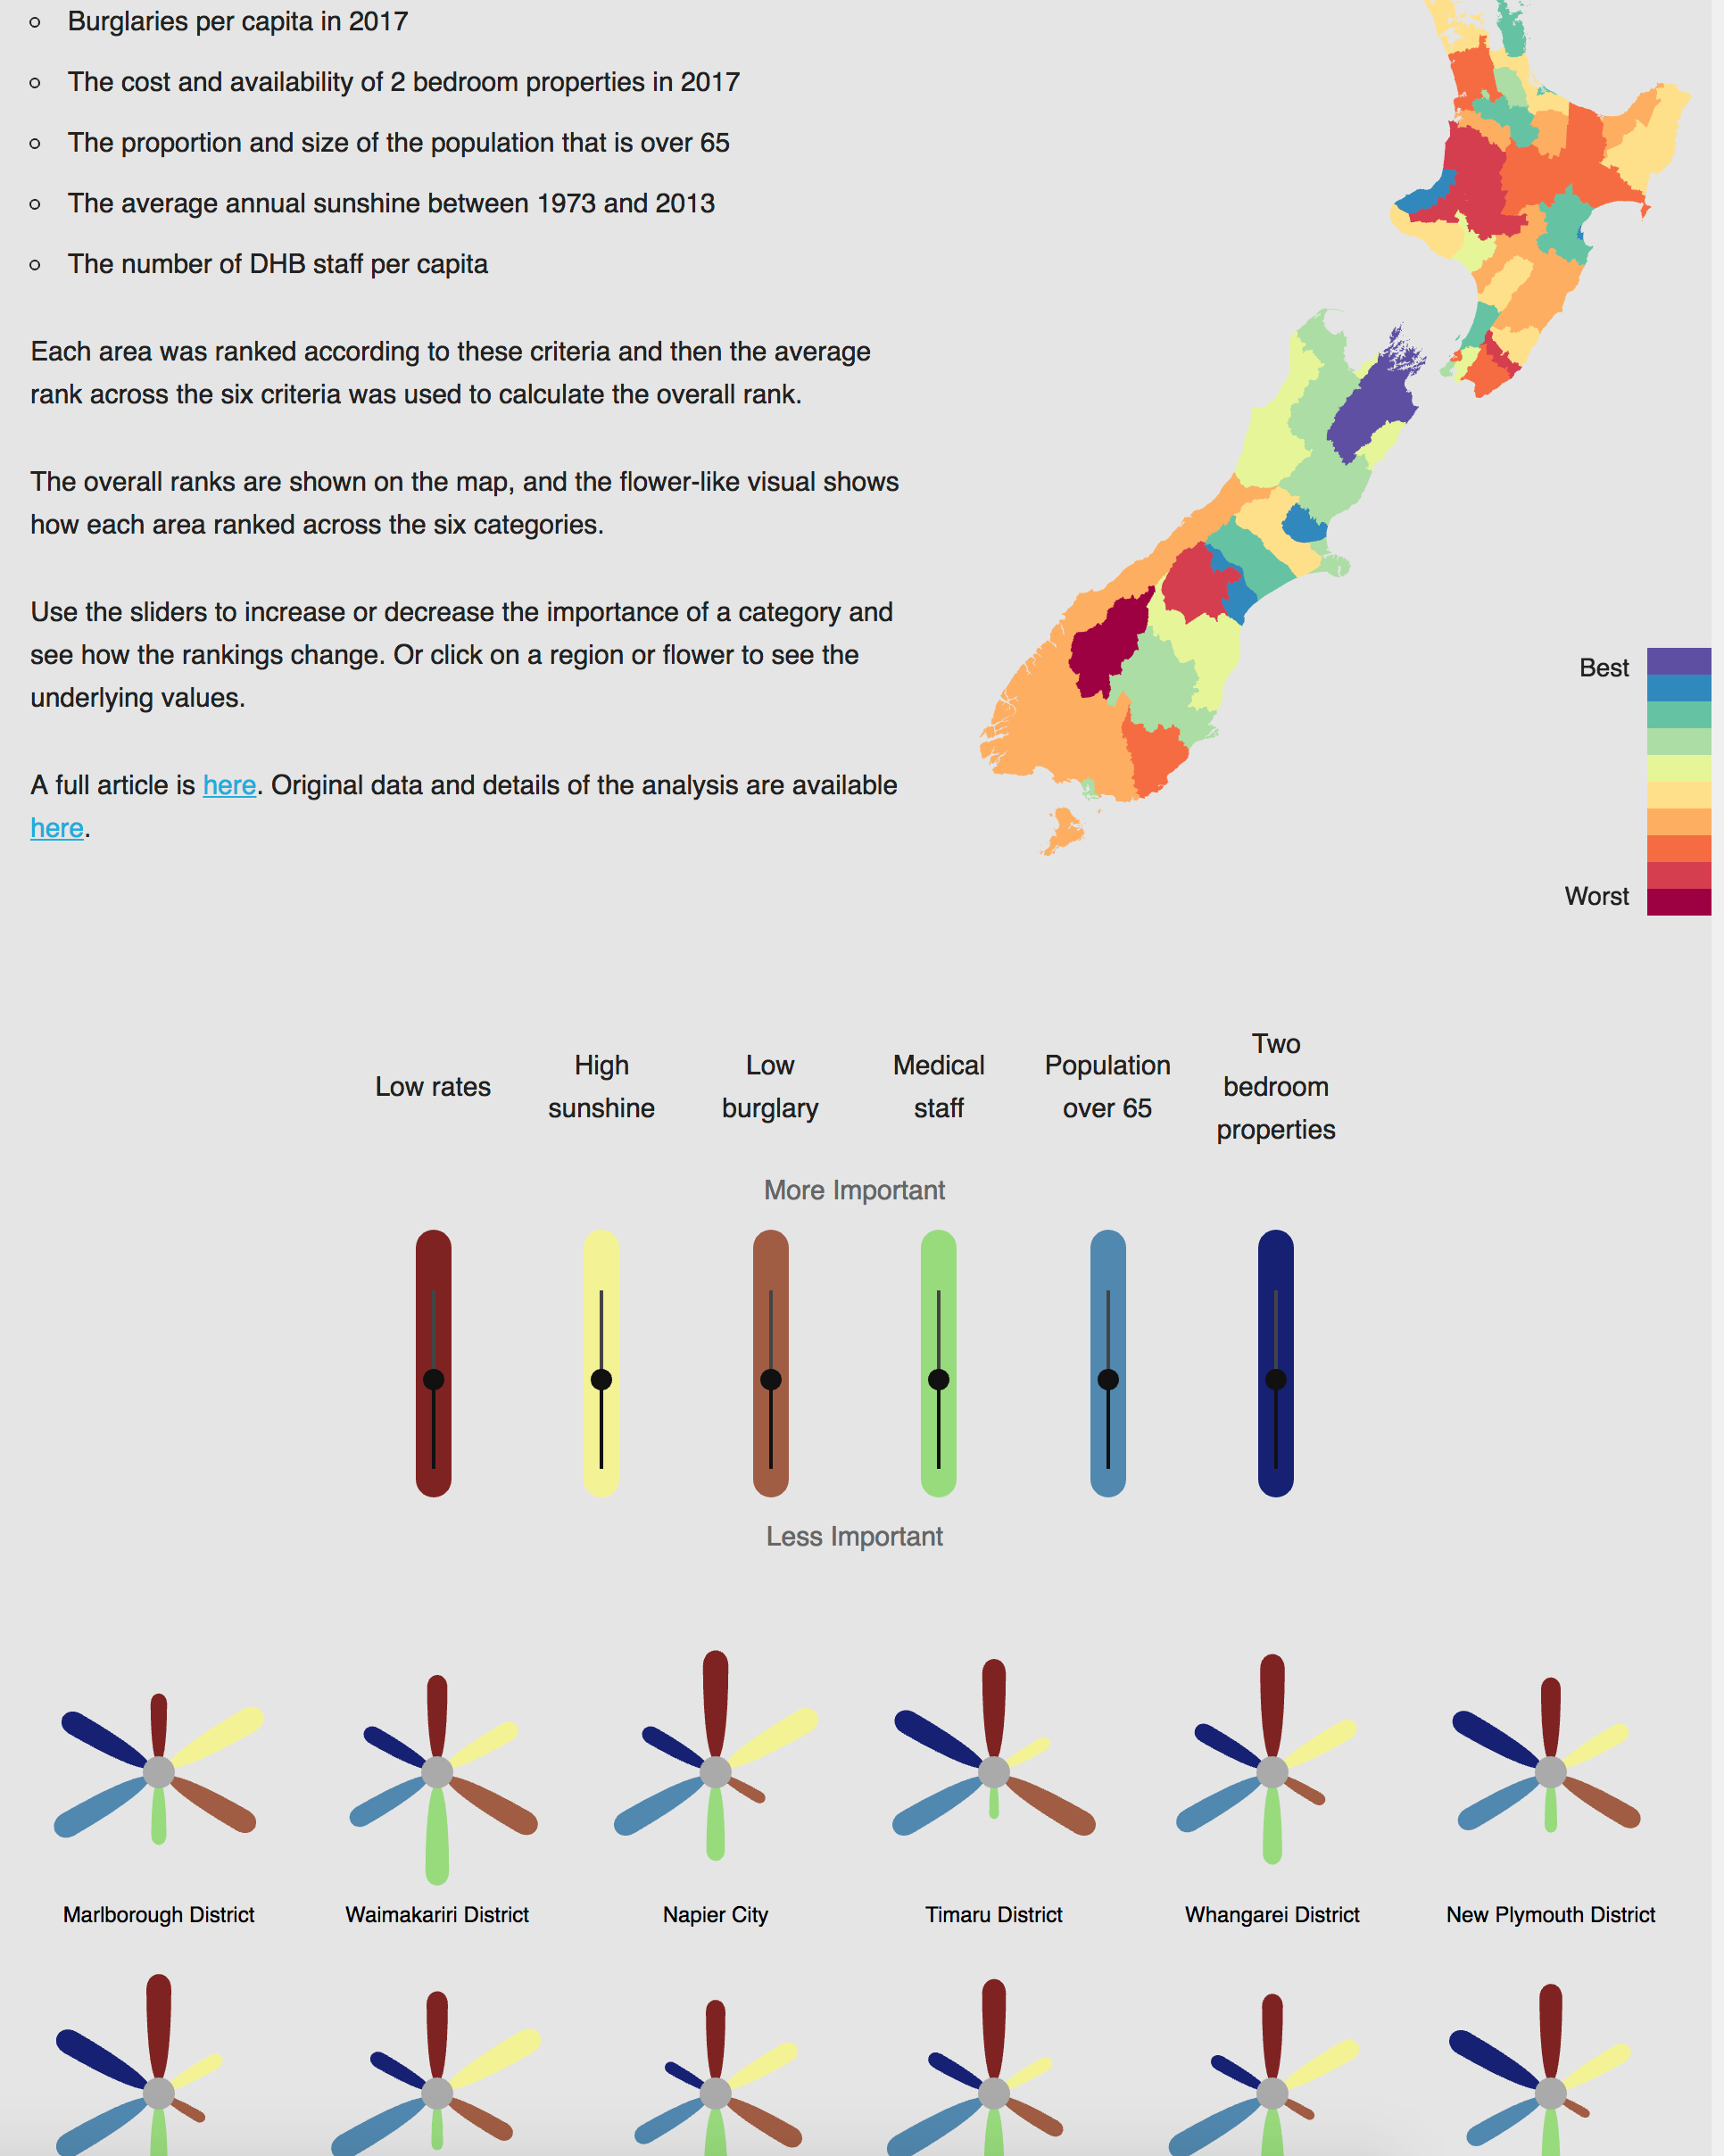
There’s a fun visualisation in the Herald of best places in NZ to retire. Chris Knox’s design lets you adjust the relative importance of a set of factors, and also see which factors are responsible for a good or bad ranking for your favorite region. For nerds, he’s even put up the code and data.

If you play around with the sliders enough, you can get Dunedin or Christchurch to the top, but you can’t get Auckland or Wellington there. Since about 30% of people over 65 actually do live in those two cities, there’s presumably some important decision factors that are left out and that would make cities look better if they were put in.

There’s at least two sorts of factors. First, that many people live in cities. You might well want to retire somewhere close to your friends and whānau.  Second, that you want the amenities of a city: public transport, taxis, libraries, cinemas, museums, stadiums, fair-quality cheap restaurants.

The interactive is just for fun, but similar principles apply to serious decision-making tools.  The ‘best’ decision depends a lot on your personal criteria for ‘best’, and oversimplifying these criteria will give you something that looks like an objective, data-based policy choice, but really isn’t.

February 2, 2018

Diagnostic accuracy: twitter followers

The New York Times and Stuff both have recent stories about fake Twitter followers. There’s an important difference. The Times focuses on a particular company that they claim sells fake followers; Stuff talks about two apps that claim to be able to detect fakes by looking at their Twitter accounts.

The difference matters. If you bought fake followers from a company such as the one the Times describes, then you (or a ‘rogue employee’) knew about it with pretty much 100% accuracy.  If you’re relying on algorithmic identification, you’d need some idea of the accuracy for it to be any use — and an algorithm that performs fairly well on average for celebrity accounts could still be wrong quite often for ordinary accounts. If you know that 80% of accounts with a given set of properties are fake, and someone has 100,000 followers with those properties, it might well be reasonable to conclude they have 80,000 fake followers.  It’s a lot less safe to conclude that a particular follower, Eve Rybody, say, is a fake.

Stuff says

Twitter Audit analyses the number of tweets, date of the last tweet, and ratio of followers to friends to determine whether a user is real or “fake”.

SocialBakers’ Maie Crumpton says it’s possible for celebrities to have 50 per cent “fake” or empty follower accounts through no fault of their own. SocialBakers’ labels an account fake or empty if it follows fewer than 50 accounts and has no followers.

Twitter Audit thinks I’ve got 50 fake followers. It won’t tell me who they are unless I pay, but I think it’s probably wrong. I have quite a few followers who are inactive or who are read-only tweeters, and some that aren’t real people but are real organisations.

Twitter users can’t guard against followers being bought for them by someone else but Brislen and Rundle agree it is up to tweeters to protect their reputation by actively managing their account and blocking fakes.

I don’t think I’d agree even if you could reliably detect individual fake accounts; I certainly don’t agree if you can’t.

January 18, 2018

Predicting the future

As you’ve heard if you’re in NZ, the Treasury got the wrong numbers for predicted impact on child poverty of Labour’s policies (and as you might not have heard, similarly wrong numbers for the previous government’s policies).

Their ‘technical note‘ is useful

In late November and early December 2017, a module was developed to further improve the Accommodation Supplement analysis. This was applied to both the previous Government’s package and the current Government’s Families Package. The coding error occurred in this “add-on module” – in a single line of about 1000 lines of code.

The quality-assurance (QA) process for the add-on module included an independent review of the methodology by a senior statistician outside the Treasury’s microsimulation modelling team, multiple layers of code review, and an independent replication of each stage by two modellers. No issues were identified during this process.

I haven’t seen their code, but I have seen other microsimulation models and as a statistics researcher I’m familiar with the problem of writing and testing code that does a calculation you don’t have any other way to do. In fact, when I got called by Newstalk ZB about the Treasury’s error I was in the middle of talking to a PhD student about how to check code for a new theoretical computation.

It’s relatively straightforward to test code when you know what the output should be for each input: you put in a set of income measurements and see if the right tax comes out, or you click on a link and see if you get taken to the right website, or you shoot the Nazi and see if his head explodes. The most difficult part is thinking of all the things that need to be checked.  It’s much harder when you don’t know what the output should even be because the whole point of writing the code is to find out.

You can test chunks of code that are small enough to be simple. You can review the code and try to see if it matches the process that you’re working from. You might be able to work out special cases in some independent way. You can see if the outputs change in sensible ways when you change the inputs. You can get other people to help. And you do all that. And sometimes it isn’t enough.

The Treasury say that they typically try to do more

This QA process, however, is not as rigorous as independent co-production, which is used for modifications of the core microsimulation model.  Independent co-production involves two people developing the analysis independently, and cross-referencing their results until they agree. This significantly reduces the risk of errors, but takes longer and was not possible in the time available.

That’s a much stronger verification approach.  Personally, I’ve never gone as far as complete independent co-production, but I have done partial versions and it does make you much more confident about the results.

The problem with more rigorous testing approaches is they take time and money and often end up just telling you that you were right.  Being less extreme about it is often fine, but maybe isn’t good enough for government work.

Measuring what you care about

There’s a story in the Guardian saying

The credibility of a computer program used for bail and sentencing decisions has been called into question after it was found to be no more accurate at predicting the risk of reoffending than people with no criminal justice experience provided with only the defendant’s age, sex and criminal history.

They even link to the research paper.

That’s all well and good, or rather, not good. But there’s another issue that doesn’t even get raised.  The algorithms aren’t trained and evaluated on data about re-offending. They’re trained and evaluated on data about re-conviction: they have to be, because that’s all we’ve got.

Suppose two groups of people have the same rate of re-offending, but one group are more likely to get arrested, tried, and convicted than the other. The group with a higher re-conviction rate will look to the algorithm as if they have a higher chance of re-offending.   They’ll get a higher predicted probability of re-offending. Evaluation will confirm they’re more likely to have the “re-offending” box ticked in their subsequent data.  The model can look like it’s good at discriminating between re-offenders and those who go straight, when it’s actually just good at discriminating against the same people as the justice system.

This isn’t an easy problem to fix: re-conviction data are what you’ve got. But when you don’t have the measurement you want, it’s important to be honest about it. You’re predicting what you measured, not what you wanted to measure.

January 8, 2018

Not dropping every year

Stuff has a story on road deaths, where Julie Ann Genter claims the Roads of National Significance are partly responsible for the increase in death rates. Unsurprisingly, Judith Collins disagrees.  The story goes on to say (it’s not clear if this is supposed to be indirect quotation from Judith Collins)

From a purely statistical viewpoint the road toll is lowering – for every 10,000 cars on the road, the number of deaths is dropping every year.

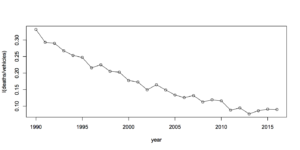
From a purely statistical viewpoint, this doesn’t seem to be true. The Ministry of Transport provides tables that show a rate of fatalities per 10,000 registered vehicles of 0.077 in 2013, 0.086 in 2014,  0.091 in 2015, and  0.090 in 2016. Here’s a graph, first raw

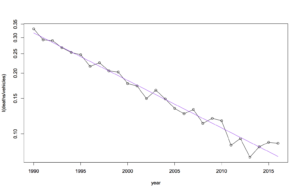
and now with a fitted trend (on a log scale, since the trend is straighter that way)

Now, it’s possible there’s some other way of defining the rate that doesn’t show it going up each year. And there’s a question of random variation as always. But if you scale for vehicles actually on the road, by using total distance travelled, we saw last year that there’s pretty convincing evidence of an increase in the underlying rate, over and above random variation.

The story goes on to say “But Genter is not buying into the statistics.” If she’s planning to make the roads safer, I hope that isn’t true.

November 23, 2017

More complicated than that

Science Daily

Computerized brain-training is now the first intervention of any kind to reduce the risk of dementia among older adults.

Daily Telegraph

Pensioners can reduce their risk of dementia by nearly a third by playing a computer brain training game similar to a driving hazard perception test, a new study suggests.

Ars Technica

Speed of processing training turned out to be the big winner. After ten years, participants in this group—and only this group—had reduced rates of dementia compared to the controls

The research paper is here, and the abstract does indeed say “Speed training resulted in reduced risk of dementia compared to control, but memory and reasoning training did not”

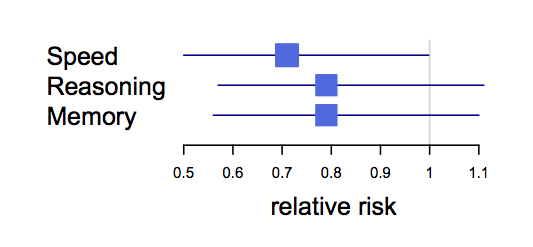
They’re overselling it a bit. First, these are intervals showing the ratios of number of cases with and without the three types of treatment, including the uncertainty

dementia

Summarising this as “speed training works but the other two don’t” is misleading.  There’s pretty marginal evidence that speed training is beneficial and even less evidence that it’s better than the other two.

On top of that, the results are for less than half the originally-enrolled participants, the ‘dementia’ they’re measuring isn’t a standard clinical definition, and this is a study whose 10-year follow-up ended in 2010 and that had a lot of ‘primary outcomes’ it was looking for — which didn’t include the one in this paper.

The study originally expected to see positive results after two years. It didn’t. Again, after five years, the study reported “Cognitive training did not affect rates of incident dementia after 5 years of follow-up.”  Ten-year results reported in 2014, showed relatively modest differences in people’s ability to take care of themselves, as Hilda Bastian commented.

So. This specific type of brain training might actually help. Or one of the other sorts of brain training they tried might help. Or, quite possibly, none of them might help.  On the other hand, these are relatively unlikely to be harmful, and maybe someone will produce an inexpensive app or something.

October 30, 2017

Past results do not imply future performance


A rugby team that has won a lot of games this year is likely to do fairly well next year: they’re probably a good team.  Someone who has won a lot of money betting on rugby this year is much less likely to keep doing well: there was probably luck involved. Someone who won a lot of money on Lotto this year is almost certain to do worse next year: we can be pretty sure the wins were just luck. How about mutual funds and the stock market?

Morningstar publishes ratings of mutual funds, with one to five stars based on past performance. The Wall Street Journal published an article saying (a) investors believe these are predictive of future performance and (b) they’re wrong.  Morningstar then fought back, saying (a) we tell them it’s based on past performance, not a prediction and (b) it is, too, predictive. And, surprisingly, it is.

Matt Levine (of Bloomberg; annoying free registration) and his readers had an interesting explanation (scroll way down)

Several readers, though, proposed an explanation. Morningstar rates funds based on net-of-fee performance, and takes into account sales loads. And fees are predictive. Funds that were good at picking stocks in the past will, on average, be average at picking stocks in the future; funds that were bad at picking stocks in the past will, on average, be average at picking stocks in the future; that is in the nature of stock picking. But funds with low fees in the past will probably have low fees in the future, and funds with high fees in the past will probably have high fees in the future. And since net performance is made up of (1) stock picking minus (2) fees, you’d expect funds with low fees to have, on average, persistent slightly-better-than-average performance.

That’s supported by one of Morningstar’s own reports.

The expense ratio and the star rating helped investors make better decisions. The star rating and expense ratios were pretty even on the success ratio–the closest thing to a bottom line. By and large, the star ratings from 2005 and 2008 beat expense ratios while expense ratios produced the best success ratios in 2006 and 2007. Overall, expense ratios outdid stars in 23 out of 40 (58%) observations.

A better data analysis for our purposes would look at star ratings for different funds matched on fees, rather than looking at the two separately.  It’s still a neat example of how you need to focus on the right outcome measurement. Mutual fund trading performance may not be usefully predictable, but even if it isn’t, mutual fund returns to the customer are, at least a little bit.


October 23, 2017

Questions to ask

There’s a story in a lot of the British media (via Robin Evans on Twitter) about a plan to raise speed limits near highway roadworks. The speed limit is currently 50mph and the proposal is to raise it to 55mph or 60mph.

Obviously this is an significant issue, with potential safety and travel time consequences.  And Highways England did some research. This is the key part of the description in the stories (presumably from a press release that isn’t yet on the Highways England website)

More than 36 participants took part in each trial and were provided with dashcams and watches incorporating heart-rate monitors and GPS trackers to measure their reactions.

The tests took place at 60mph on the M5 between junction 4a (Bromsgrove) to 6 (Worcester) and at 55mph on the M3 in Surrey between junction 3 and 4a.

According to Highways England 60% of participants recorded a decrease in average heart rate in the 60mph trial zone and 56% presented a decrease on the 55mph trial.

That’s a bit light on detail — how many more than 36; does 60% decrease mean 40% increase; are they saying that the 4 percentage point difference between 55 and 60mph is enough to matter or not enough to matter?

More importantly, though, why is a heart rate decrease in drivers even the question?  I’m not saying it can’t be. Maybe there’s some good reason why it’s reliable information about safety, but if there is the journalists didn’t think to ask about it.

A few stories, such as the one in the Mirror, had a little bit more

“Increasing the speed limit to 60mph where appropriate also enables motorists who feel threatened by the close proximity of HGVs in roadworks to free themselves.”

Even so, is this a finding of the research (why motorists felt safer, or even that they felt safer)? Is it a conclusion from the heart rate monitors? Is it from asking the drivers? Is it just a hypothetical explanation pulled out of the air?

If you’re going to make a scientific-sounding measurement the foundation of this story, you need to explain why it answers some real question. And linking to more information would, as usual, be nice.