Posts filed under Research (206)

February 20, 2015

Why we have controlled trials


joc80747f2

The graph is from a study — a randomised, placebo-controlled trial published in a top medical journal — of a plant-based weight loss treatment, an extract from Garcinia cambogia, as seen on Dr Oz. People taking the real Garcinia cambogia lost weight, an average of 3kg over 12 weeks. That would be at least a little impressive, except that people getting pretend Garcinia cambogia lost an average of more than 4kg over the same time period.  It’s a larger-than-usual placebo response, but it does happen. If just being in a study where there’s 50:50 chance of getting a herbal treatment can lead to 4kg weight loss, being in a study where you know you’re getting it could produce even greater ‘placebo’ benefits.

If you had some other, new, potentially-wonderful natural plant extract that was going to help with weight loss, you might start off with a small safety study. Then you’d go to a short-term, perhaps uncontrolled, study in maybe 100 people over a few weeks to see if there was any sign of weight loss and to see what the common side effects were. Finally, you’d want to do a randomised controlled trial over at least six months to see if people really lost weight and kept it off.

If, after an uncontrolled eight-week study, you report results for only 52 of 100 people enrolled and announce you’ve found “an exciting answer to one of the world’s greatest and fastest growing problems” you perhaps shouldn’t undermine it by also saying “The world is clearly looking for weight-loss products which are proven to work.”


[Update: see comments]

February 12, 2015

Two types of brain image study

If a brain imaging study finds greater activation in the asymmetric diplodocus region or increased thinning in the posterior homiletic, what does that mean?

There are two main possibilities. Some studies look at groups who are different and try to understand why. Other studies try to use brain imaging as an alternative to measuring actual behaviour. The story in the Herald (from the Washington Post), “Benefit of kids’ music lessons revealed – study” is the second type.

The researchers looked at 334 MRI brain images from 232 young people (so mostly one each, some with two or three), and compared the age differences in young people who did or didn’t play a musical instrument.  A set of changes that happens as you grow up happened faster for those who played a musical instrument.

“What we found was the more a child trained on an instrument,” said James Hudziak, a professor of psychiatry at the University of Vermont and director of the Vermont Center for Children, Youth and Families, “it accelerated cortical organisation in attention skill, anxiety management and emotional control.

An obvious possibility is that kids who play a musical instrument have different environments in other ways, too.  The researchers point this out in the research paper, if not in the story.  There’s a more subtle issue, though. If you want to measure attention skill, anxiety management, or emotional control, why wouldn’t you measure them directly instead of measuring brain changes that are thought to correlate with them?

Finally, the effect (if it is an effect) on emotional and behavioural maturation (if it is on emotional and behavioural maturation) is very small. Here’s a graph from the paper
PowerPoint Presentation


The green dots are the people who played a musical instrument; the blue dots are those who didn’t.  There isn’t any dramatic separation or anything — and to the extent that the summary lines show a difference it looks more as if the musicians started off behind and caught up.

January 31, 2015

Big buts for factoid about lying

At StatsChat, we like big buts, and an easy way to find them is unsourced round numbers in news stories. From the Herald (reprinted from the Telegraph, last November)

But it’s surprising to see the stark figure that we lie, on average, 10 times a week.

It seems that this number comes from an online panel survey in the UK last year (Telegraph, Mail) — it wasn’t based on any sort of diary or other record-keeping, people were just asked to come up with a number. Nearly 10% of them said they had never lied in their entire lives; this wasn’t checked with their mothers.  A similar poll in 2009 came up with much higher numbers: 6/day for men, 3/day for women.

Another study, in the US, came up with an estimate of 11 lies per week: people were randomised to trying not to lie for ten weeks, and the 11/week figure was from the control group.  In this case people really were trying to keep track of how often they lied, but they were a quite non-representative group. The randomised comparison will be fair, but the actual frequency of lying won’t be generalisable.

The averages are almost certainly misleading, because there’s a lot of variation between people. So when the Telegraph says

The average Briton tells more than 10 lies a week,

or the Mail says

the average Briton tells more than ten lies every week,

they probably mean the average number of self-reported lies was more than 10/week, with the median being much lower. The typical person lies much less often than the average.

These figures are all based on self-reported remembered lies, and all broadly agree, but another study, also from the US, shows that things are more complicated

Participants were unaware that the session was being videotaped through a hidden camera. At the end of the session, participants were told they had been videotaped and consent was obtained to use the video-recordings for research.

The students were then asked to watch the video of themselves and identify any inaccuracies in what they had said during the conversation. They were encouraged to identify all lies, no matter how big or small.

The study… found that 60 percent of people lied at least once during a 10-minute conversation and told an average of two to three lies.


January 30, 2015

Meet Statistics summer scholar Ying Zhang

Ying Zhang Photo

Every year, the Department of Statistics offers summer scholarships to a number of students so they can work with staff on real-world projects. Ying, right, is working on a project called Service overview, client profile and outcome evaluation for Lifeline Aotearoa Face-to-Face Counselling Services  with the Department of Statistics’ Associate Professor David Scott and Christine Dong, research and clinical engagement manager, Lifeline and also an Honorary Research Fellow in the Department of Psychological Medicine at the University of Auckland. Ying explains:

“Lifeline New Zealand is a leading provider of dedicated community helpline services, face-to-face counselling and suicide prevention education. The project aims to investigate the client profile, the clinical effectiveness of the service and client experiences of, and satisfaction with, the face-to-face counselling service.

“In this project, my work includes three aspects: Data entry of client profiles and counselling outcomes; qualitative analysis of open-ended questions and descriptive analysis; and modelling for the quantitative variables using SAS.

“Very few research studies have been done in New Zealand to explore client profiles or find out clients’ experiences of, and satisfaction with, community face-to-face counselling services. Therefore, the study will add evidence in terms of both clinical effectiveness and client satisfaction. This study will also provide a systematic summary of the demographics and clinical characteristics of people accessing such services. It will help provide direction for strategies to improve the quality and efficiency of the service.

“I have just graduated from the University of Auckland with a Postgraduate Diploma in Statistics.  I got my bachelor and master degrees majoring in information management and information systems at Zhejiang University in China.

“My first contact with statistics was around 10 years ago when I was at university in China. It was an interesting but complex subject for me. After that, I did some internship work relating to data analysis. It helped me accumulate more experience about using data analysis to help inform business decisions.

“This summer, apart from participating in the project, I will spend some time expanding my knowledge of SAS – it’s a very useful tool and I want to know it better. I’m also hoping to find a full-time job in data analysis.”


January 28, 2015

Meet Statistics summer scholar Kai Huang

Kai Huang croppedEvery year, the Department of Statistics offers summer scholarships to a number of students so they can work with staff on real-world projects. Kai, right, is working on a project called Constrained Additive Ordination with Dr Thomas Yee. Kai explains:

“In the early 2000s, Dr Thomas Yee proposed a new technique in the field of ecology called Constrained Additive Ordination (CAO) that solves the problems about the shape of species’ response curves and how they are distributed along unknown underlying gradients, and meanwhile the CAO-oriented Vector Generalised Linear and Additive Models (VGAM) package for R has been developed. This summer, I am compiling code for improving performance for the VGAM package by facilitating the integration of R and C++ under the R environment.

“This project brings me the chance to work with a package in worldwide use and stimulates me to learn more about writing R extensions and C++ compilation. I don’t have any background in ecology, but I acquired a lot before I started this project.

“I just have done the one-year Graduate Diploma in Science in Statistics at the University of Auckland after graduating from Massey University at Palmerston North with a Bachelor of Business Studies in Finance and Economics. In 2015, I’ll be doing an honours degree in Statistics. Statistics is used in every field, which is awesome to me.

“This summer, I’ll be spending my days rationally, working with numbers and codes, and at night, romantically, spending my spare time with stars. Seeing the movie Interstellar [a 2014 science-fiction epic that features a crew of astronauts who travel through a wormhole in search of a new home for humanity] reignited my curiosity about the universe, and I have been reading astronomy and physics books in my spare time this summer. I even bought an annual pass to Stardome, the planetarium at Auckland, and have spent several evenings there.”


January 23, 2015

Where did I come from?

One of the popular uses of recreational genotyping is ancestry determination.  Everyone inherits mitochondria only from our mothers, who got it from their mothers, and so on. Your mitochondrial DNA is a good match for your greatnth-grandmother, and people will sell you stories about where she came from.  In men, the Y chromosome does the same job for male-line ancestry.

When you go back even 50 generations (eg, very roughly to the settlement of New Zealand, or the Norman Conquest), you have approximately a million billion ancestors, obviously with rather a lot of overlap. You might wonder if the single pure female line ancestor was representative, and how informative she was about your overall ancestry.

In a new paper in the American Journal of Human Genetics, researchers looked at what you’d conclude about ancestry from the mitochondrial DNA compared to what you’d conclude from the whole genome.  They weren’t trying to get this very precise, just down to what continent most of your ancestors came from. This is what they found:

Continental-ancestry proportions often varied widely among individuals sharing the same mtDNA haplogroup. For only half of mtDNA haplogroups did the highest average continental-ancestry proportion match the highest continental-ancestry proportion of a majority of individuals with that haplogroup. Prediction of an individual’s mtDNA haplogroup from his or her continental-ancestry proportions was often incorrect. Collectively, these results indicate that for most individuals in the worldwide populations sampled, mtDNA-haplogroup membership provides limited information about either continental ancestry or continental region of origin.

The agreement was better than chance — there is some information about ancestry from just your greatnth-grandmother — but not very good. It wasn’t even a particularly severe test, since the samples were a set that had been previously selected to expand the diversity of genome sequencing and were deliberately spread out around the world.  In a random group of young adults from London or New York or Rio you’d expect to do worse.

Meet Statistics summer scholar Bo Liu

Photo Bo LiuEvery year, the Department of Statistics offers summer scholarships to a number of students so they can work with staff on real-world projects. Bo, right, is working on a project called Construction of life-course variables for the New Zealand Longitudinal Census (NZLC) with Roy Lay-Yee, Senior Research Fellow at the COMPASS Research Centre, University of Auckland, and Professor Alan Lee of Statistics. Bo explains:

“The New Zealand Longitudinal Census has linked individuals across the 1981-2006 New Zealand censuses. This enables the assessment of life-course resources with various outcomes.

“I need to create life-course variables such as socio-economic status, health, education, work, family ties and cultural identity from the censuses. Sometimes such information is not given directly in the census questions, but several pieces of information need to be combined together.

“An example is the overcrowding index that measures the personal living space. We need to combine the age, partnership status of the residents and number of bedrooms in each dwelling to derive the index.

“Also, the format of the questionnaire as well as the answers used in each census were rather different, so data-cleaning is required. I need to harmonise information collected in each census so that they are consistent and can be compared over different censuses. For example, in one census the gender might be given code ‘0’ and ‘1’ representing female and male, but in another census the gender was given code ‘1’ and ‘2’. Thus the code ‘1’ can mean quite different things in different censuses. My job is to find these differences and gaps in each census.

“The results of this project will enable future studies based on New Zealand longitudinal censuses, say, for example, the influence of life-courses variables on the risk of mortality. This project will also be a very good experience for my future career, since data-cleaning is a very important process that we were barely taught in our courses but will actually cost almost one-third of the time in most real-life projects. When we were studying statistics courses, most data sets we encountered were “toy” data sets that had fewer variables and observations and were clean. However, in real life, as in this case, we often meet with data that have millions of observations, hundreds of variables, and inconsistent variable specification and coding.

“I hold a Bachelor of Commerce in Accounting, Finance and Information Systems. I have just completed Postgraduate Diploma in Science, majoring in Statistics, and in 2015, I will be doing Master of Science in Statistics.

“When I was studying information systems, my lecturer introduced several statistical techniques to us and I was fascinated by what statistics is capable of in the decision-making process. For example, retailers can find out if a customer is pregnant purely based on her purchasing behaviour, so the retailers can send out coupons to increase their sales. It is amazing how we can use statistical techniques to find that little tiny bit of useful information in oceans of data. Statistics appeals to me as it is highly useful and applicable in almost every industry.

“This summer, I will spend some time doing road trips – hopefully I can make it to the South Island this time. I enjoy doing road trips alone every summer as I feel this is the best way to get myself refreshed and motivated for the next year.”


January 22, 2015

Meet Statistics summer scholar Yiying Zhang

yiyingEvery year, the Department of Statistics offers summer scholarships to a number of students so they can work with staff on real-world projects. Yiying, right, is working on a project called Modelling Competition and Dispersal in a Statistical Phylogeographic Framework with Dr Stéphane GuindonYiying explains.

 “The processes that govern the spatial distribution of species are complex. Traditional approaches in ecology generally rely on the hypothesis that adaptation to the environment is the main force driving this distribution.

“The supervisors of this project propose an alternative explanation that assumes that species are found in certain places simply because they were the first to colonise these locations during the course of evolution. They have recently designed a stochastic model that explains the observed spatial distribution of species using a combination of dispersal events (i.e., species migrating to new territories) and competition between species.

“In this project, I will run in silico [computer] experiments and analyse real data in order to validate the software Phyloland that implements our dispersal-competition model.

“To validate the model, we will randomly generate ‘true value’. Then we will use the model to make estimations of the true value. If the estimated values match the true value relatively closely, then the model is reliable.

“I am doing a BCom/BSc conjoint degree. My majors are Finance, Accounting and Statistics – 2015 is my fourth year. I am planning to do an Honours degree in statistics, so this summer research project is a very valuable experience for me.

“I enjoy statistics because it brings me closer to the real world. Sometimes, things are not simply what we see. Without data, we would never have convincing evidence about what is really happening. The amount of information out there is massive and statistics can help people tell how reliable a statement is. Studying statistics has helped me make better use of information and think more critically.

“My plans for summer include relaxing and reading more books. And having plenty of sleep.”


January 3, 2015

Cancer isn’t just bad luck

From Stuff

Bad luck is responsible for two-thirds of adult cancer while the remaining cases are due to environmental risk factors and inherited genes, researchers from the Johns Hopkins Kimmel Cancer Center found.

The idea is that some, perhaps many, cancers come from simple copying errors in DNA replication. Although DNA copying and editing is impressively accurate, there’s about one error for every three cell divisions, even when nothing is wrong. Since the DNA error rate is basically constant, but other risk factors will be different for different cancers, it should be possible to separate them out.

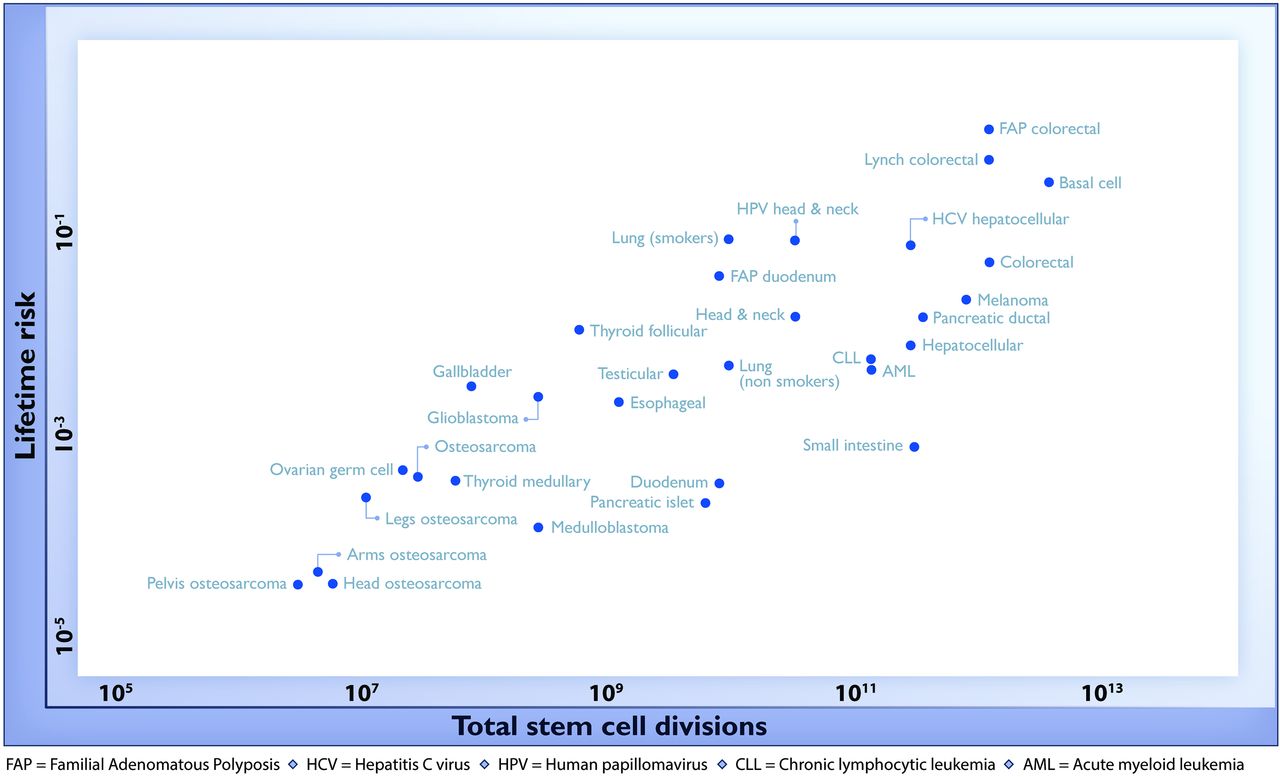
For a change, this actually is important research, but it has still been oversold, for two reasons. Here’s the graph from the paper showing the ‘2/3’ figure: the correlation in this graph is about 0.8, so the proportion of variation explained is the square of that, about two-thirds.  (click to embiggen)

cancer-logrisk

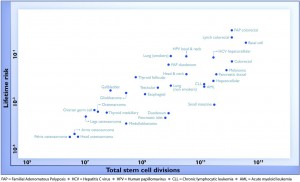
There are two things to notice about this graph. First, there are labels such as “Lung (smokers)” and “Lung (non-smokers)”, so it’s not as simple as ‘bad luck’.  Some risk factors have been taken into account. It’s not obvious whether this makes the correlation higher or lower.

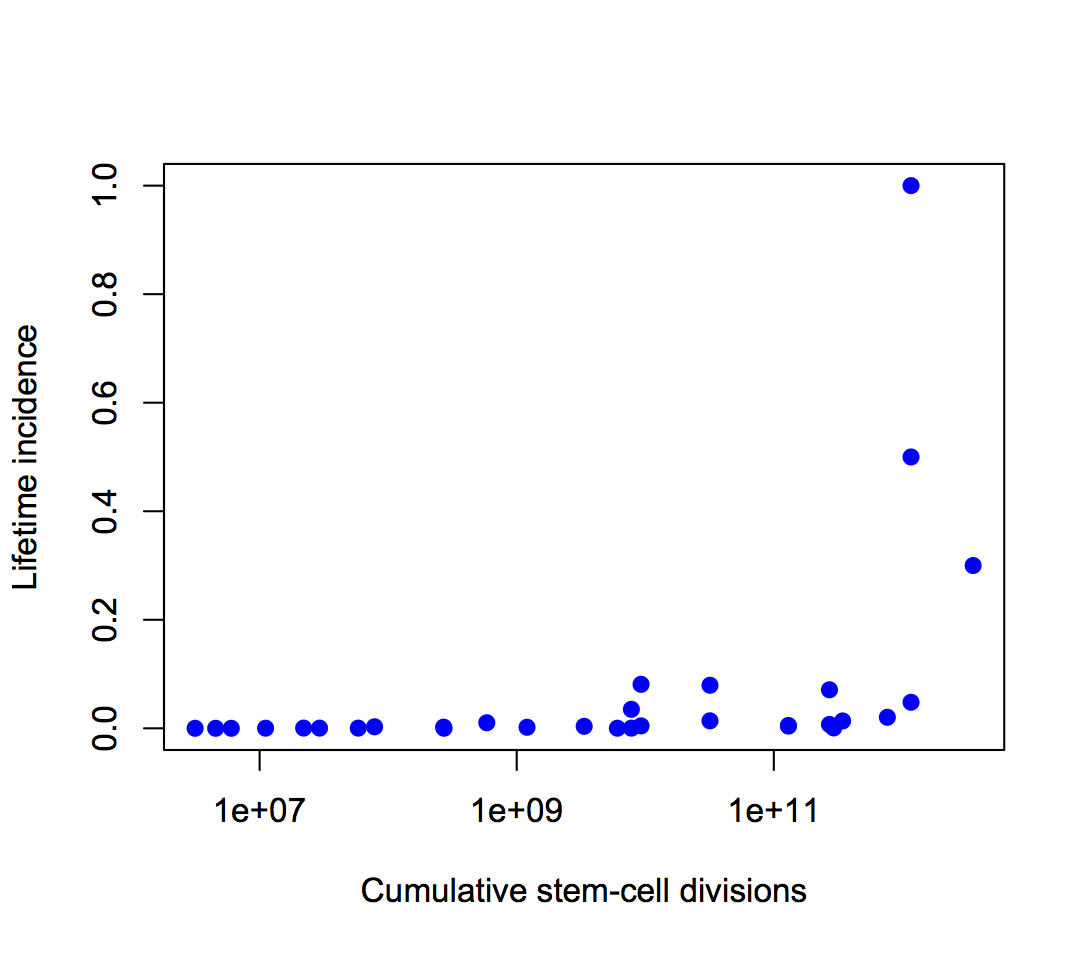
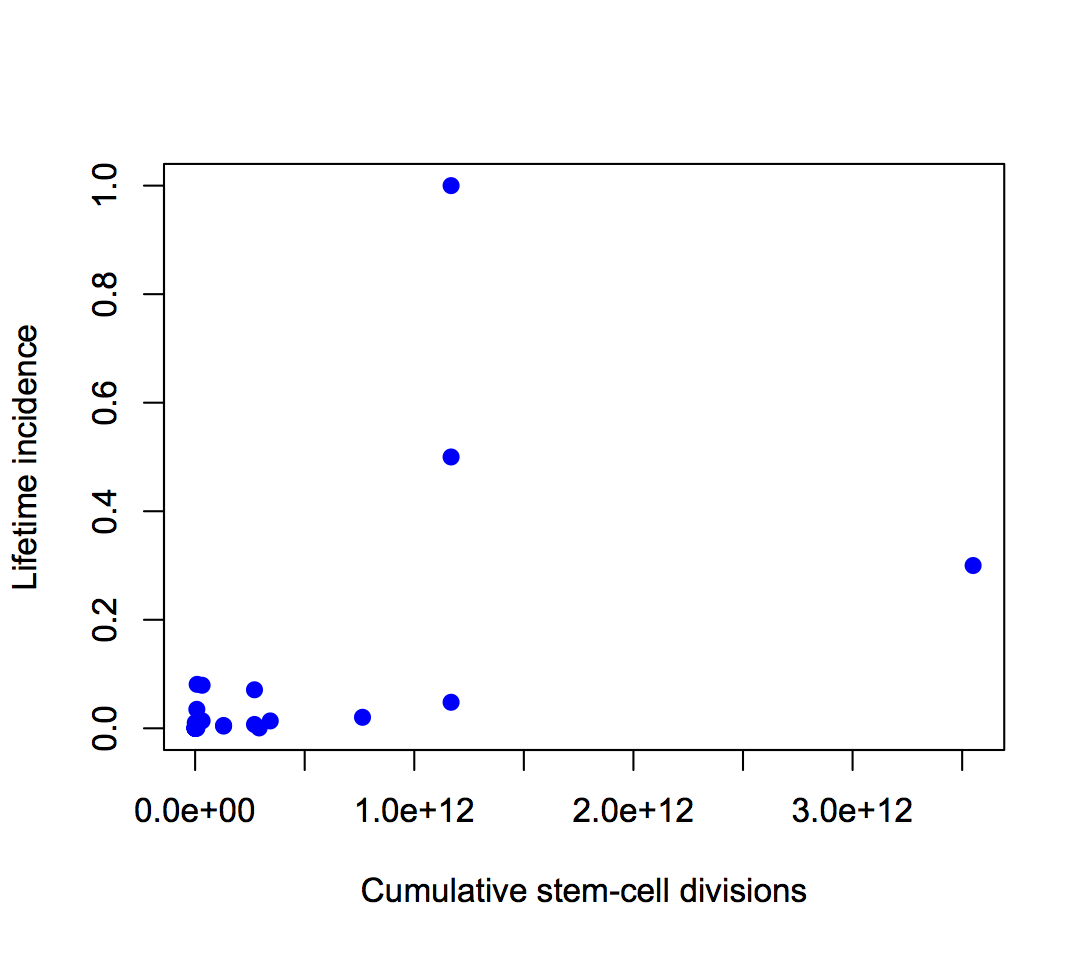
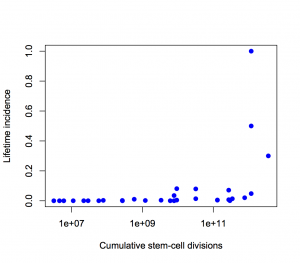
Second, the y-axis is on a log scale, so the straight line fit isn’t to cancer incidence and the proportion of variation explained isn’t a proportion of cancer risk.  Using a log scale for incidence is absolutely right when showing the biological relationship, but you can’t read proportions of incidence explained off that graph.  This is what the graph looks like when the y-axis is incidence, either with the x-axis still on a logarithmic scale

semilog

or with neither axis on a logarithmic scale

nolog

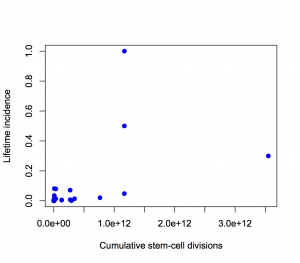
The proportion of variation explained is 18% and 28% respectively.

It’s ok to transform the x-axis as much as we like, so I looked at a square root transformation on the x-axis (based on the slope of the log-log graph). This gets the proportion of incidence explained up to about one third. Not two-thirds.

Using the log scale gives a lot more weight to the very rare cancers in the lower left corner, which turn out not to have important modifiable risk factors. Using an untransformed y-axis gives equal weight to all cancers, which is what you want from a medical or public health point of view.

Except, even that isn’t quite right. If you look at my two graphs it’s clear that the correlation will be driven by the top three points. Two of those are familial colorectal cancers, and the incidence quoted is the incidence in people with the relevant mutations; the third is basal cell carcinoma, which barely counts as cancer from a medical or public health viewpoint

If we leave out the familial cancers and basal cell carcinoma, the proportion explained drops to about 10%.

If we leave out put back basal cell carcinoma as well, something statistically interesting happens. The correlation shoots back up again, but only because it’s being driven by a single point. A more honest correlation estimate, predicting each point based on the other points and not based on itself, is much lower.

So, in summary: the “two-thirds of cancers explained” is Just Wrong. Doing a mathematically correct calculation gives about one third. Doing a calculation that’s actually relevant to cancer in the population gives even smaller values. (update) That’s not to say that DNA replication errors are unimportant — the paper makes it clear that they are important.

January 2, 2015

Is this being sold to people who care if it works?

The Marlborough Express has a story today that begins

Kaye Nicholls tried every diet in the book without success but a fat-busting capsule produced by a Blenheim company has proved the catalyst for her weight loss.

The 54-year-old has shed a whopping 13.5 kilograms in eight weeks as part of the company’s “fat mates” trial in Blenheim.

It’s presumably no coincidence that this story appears on January 2nd, ready to exploit the New Year’s Resolution wave of dieters.

As you will have guessed, Ms Nicholls weight loss wasn’t typical. We aren’t told what the average weight loss was, just

“Tuatara Natural Products director Neil Charles-Jones said half the people on the trial lost an average of 5kg and the top 25 per cent shed more than 7kg.

That is, the average was 5kg loss among the 50% who lost the most — as far as we can tell from the story, the loss averaged over everyone could be zero.

Not only are we not told the average, the trial was uncontrolled, which makes it hard to tell how much of any benefit was due to the pill and how much just to starting a weight loss program.  The company does know that this is a problem, and so does the journalist, because the story actually says

Weight loss results were being sent to a bio-analyst to compare the capsule with the placebo effect and conclusions would be drawn by mid January.

You might wonder how they’re doing the comparison. The best way would be to look at how much weight is lost in people trying new, ineffective, weight loss products in uncontrolled trials. Slightly less good would be to use data from the placebo arm of controlled trials — it wouldn’t be as good, because we’re trying for a fair comparison, and this wasn’t a controlled trial.

However the analysis is being done, it is being done. The results will be available in a couple of weeks. If you cared about whether these pills really work, that would be the time to report the results.

If this were a medicine, controlled trials would be needed before it could be advertised and sold: the FDA criteria are weight loss of at least 5% persisting for at least a year.  It would also be illegal to use testimonials in advertising it. As it is, I’d guess a paper would think twice about accepting this story if it were a paid ad.

What’s really upsetting about the story is that this isn’t just pseudoscience. Tuatara Natural Products has public funding through both Plant & Food and Callaghan Innovation. Their product has a sensible mechanism (inhibition of α-amylase in the gut to slow down carbohydrate absorption). They should be interested in doing better.


(note: JohnPickering has a grumpier post about the same story)