Posts filed under Research (206)

March 23, 2015

Population genetic history mapped

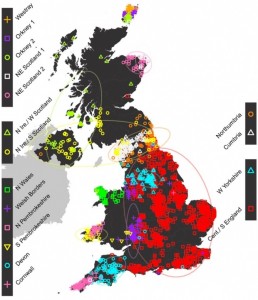
Most stories about population genetic ancestry tend to be based on pure male-line or pure female-line ancestry, which can be unrepresentative.  That’s especially true when you’re looking at invasions — invaders probably leave more Y-chromosomes behind than the rest of the genome.  There’s a new UK study that used data on the whole genome from a few thousand British people, chosen because all four of their grandparents lived close together.  The idea is that this will measure population structure at the start of the twentieth century, before people started moving around so much.

Here’s the map of ancestry clusters. As the story in the Guardian explains, one thing it shows that the Romans and Normans weren’t big contributors to population ancestry, despite their impact on culture.

0b02a9ee-3110-4323-8654-ee559ee03cc0-875x1020

March 19, 2015

Model organisms

The flame retardant chemicals in your phone made zebra fish “chubby”, says the caption on this photo at news.com.au. Zebra fish, as it explains, are a common model organism for medical research, so this could be relevant to people

591917-2a8735a0-cced-11e4-a716-dcac481e1bbe

On the other hand, as @LewSOS points out on Twitter, it doesn’t seem to be having the same effect on the model organisms in the photo.

What’s notable about the story is how much better it is than the press release, which starts out

Could your electronics be making you fat? According to University of Houston researchers, a common flame retardant used to keep electronics from overheating may be to blame.

The news.com.au story carefully avoids repeating this unsupported claim.  Also, the press release doesn’t link to the research paper, or even say where it was published (or even that it was published). That’s irritating in the media but unforgivable in a university press release.   When you read the paper it turns out the main research finding was that looking at fat accumulation in embryonic zebrafish (which is easy because they are transparent, one of their other advantages over mice) was a good indication of weight gain later in life, and might be a useful first step in deciding which chemicals were worth testing in mice.

So, given all that, does your phone or computer actually expose you to any meaningful amount of this stuff?

The compounds in question, Tetrabromobisphoneol A (TBBPA) and tetrachlorobisphenol A (TCBPA) can leach out of the devices and often end up settling on dust particles in the air we breathe, the study found.

That’s one of the few mistakes in the story: this isn’t what the study found, it’s part of the background information. In any case, the question is how much leaches out. Is it enough to matter?

The European Union doesn’t think so

The highest inhalation exposures to TBBP-A were found in the production (loading and mixing) of plastics, with 8-hour time-weighted-averages (TWAs) up to 12,216 μg/m3 . At the other end of the range, offices containing computers showed TBBP-A air concentrations of less than 0.001 μg/m3 . TBBP-A exposures at sites where computers were shredded, or where laminates were manufactured ranged from 0.1 to 75 μg/m3 .

You might worry about the exposures from plastics production, and about long-term environmental accumulations, but it looks like TBBP-A from being around a phone isn’t going to be a big contributor to obesity. That’s also what the international comparisons would suggest — South Korea and Singapore have quite a lot more smartphone ownership than Australia, and Norway and Sweden are comparable, all with much less obesity.

March 18, 2015

Men sell not such in any town

Q: Did you see diet soda isn’t healthier than the stuff with sugar?

A: What now?

Q: In Stuff: “If you thought diet soft drink was a healthy alternative to the regular, sugar-laden stuff, it might be time to reconsider.”

A: They didn’t compare diet soft drink to ‘the regular, sugar-laden stuff’.

Q: Oh. What did they do?

A: They compared people who drank a lot of diet soft drink to people who drank little or none, and found the people who drank a lot of it gained more weight.

Q: What did the other people drink?

A: The story doesn’t say. Nor does the research paper, except that it wasn’t ‘regular, sugar-laden’ soft drink, because that wasn’t consumed much in their study.

Q: So this is just looking at correlations. Could there have been other differences, on average, between the diet soft drink drinkers and the others?

A: Sure. For a start, there was a gender difference and an ethnicity difference. And BMI differences at the start of the study.

Q: Isn’t that a problem?

A: Up to a point. They tried to adjust these specific differences away, which will work at least to some extent. It’s other potential differences, eg in diet, that might be a problem.

Q: So the headline “What diet drinks do to your waistline” is a bit over the top?

A: Yes. Especially as this is a study only in people over 65, and there weren’t big differences in waistline at the start of the study, so it really doesn’t provide much information for younger people.

Q: Still, there’s some evidence diet soft drink is less healthy than, perhaps, water?

A: Some.

Q: Has anyone even claimed diet soft drink is healthier than water?

A: Yes — what’s more, based on a randomised trial. I think it’s fair to say there’s a degree of skepticism.

Q: Are there any randomised trials of diet vs sugary soft drinks, since that’s what the story claimed to be about?

A: Not quite. There was one trial in teenagers who drank a lot of sugar-based soft drinks. The treatment group got free diet drinks and intensive nagging for a year; the control group were left in peace.

Q: Did it work?

A: A bit. After one year the treatment group  had lower weight gain, by nearly 2kg on average, but the effect wore off after the free drinks + nagging ended. After two years, the two groups were basically the same.

Q: Aren’t dietary randomised trials depressing?

A: Sure are.
 

Awful graphs about interesting data


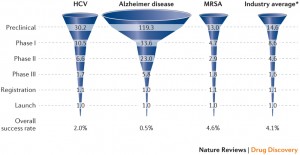
Today in “awful graphs about interesting data” we have this effort that I saw on Twitter, from a paper in one of the Nature Reviews journals.

nrd4570-f2

As with some other recent social media examples, the first problem is that the caption isn’t part of the image and so doesn’t get tweeted. The numbers are the average number of drug candidates at each stage of research to end up with one actual drug at the end. The percentage at the bottom is the reciprocal of the number at the top, multiplied by 60%.

A lot of news coverage of research is at the ‘preclinical’ stage, or is even earlier, at the stage of identifying a promising place to look.  Most of these never get anywhere. Sometimes you see coverage of a successful new cancer drug candidate in Phase I — first human studies. Most of these never get anywhere.  There’s also a lot of variation in how successful the ‘successes’ are: the new drugs for Hepatitis C (the first column) are a cure for many people; the new Alzheimer’s drugs just give a modest improvement in symptoms.  It looks as those drugs from MRSA (antibiotic-resistant Staph. aureus) are easier, but that’s because there aren’t many really novel preclinical candidates.

It’s an interesting table of numbers, but as a graph it’s pretty dreadful. The 3-d effect is purely decorative — it has nothing to do with the represntation of the numbers. Effectively, it’s a bar chart, except that the bars are aligned at the centre and have differently-shaped weird decorative bits at the ends, so they are harder to read.

At the top of the chart,  the width of the pale blue region where it crosses the dashed line is the actual data value. Towards the bottom of the chart even that fails, because the visual metaphor of a deformed funnel requires the ‘Launch’ bar to be noticeably narrower than the ‘Registration’ bar. If they’d gone with the more usual metaphor of a pipeline, the graph could have been less inaccurate.

In the end, it’s yet another illustration of two graphical principles. The first: no 3-d graphics. The second: if you have to write all the numbers on the graph, it’s a sign the graph isn’t doing its job.

March 13, 2015

Clinical trial reporting still not happening

According to a paper in the New England Journal of Medicine, about 20% of industry-funded clinical trials registered in the United States failed to report their summary results with no legally acceptable reason for delay. That’s obviously not good enough, and this sort of thing is why people don’t like drug companies.

As the paper says

On the basis of this review, we estimated that during the 5-year period, approximately 79 to 80% of industry-funded trials reported summary results or had a legally acceptable reason for delay. In contrast, only 49 to 50% of NIH-funded trials and 42 to 45% of those funded by other government or academic institutions reported results or had legally acceptable reasons for delay.

Um. Yes. <coughs nervously> <shuffles feet>

via Derek Lowe

Feel-good gene?

From Stuff

Suffering anxiety, is not a mark of character, but at least in part to do with the genetic lottery, he says.

“About 20 per cent of adult Americans have this mutation,” Professor Friedman says of those who produce more anandamide, whose name is taken from the Sanskrit word for bliss.

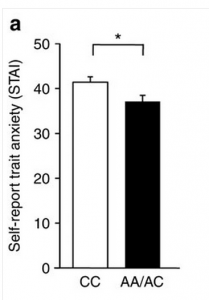
There’s good biological research behind this story, on how the gene works in both mice and people, but the impact is being oversold. The human data on anxiety in the paper look like

feelgood

Combining this small difference with the claim that 20% of people  in the US carry the variant, it would explain about 1% of the population variation in the anxiety questionnaire score. Probably less of the variation in having/not having clinically diagnosable anxiety.

The story continues

“Those who do [have this mutation] may also be less likely to become addicted to marijuana and, possibly, other drugs – presumably because they don’t need the calming effects that marijuana provides.”

The New York Times version mentioned a study of marijuana dependence, which found people with the low-anxiety mutation were less likely to be dependent. However, for other drugs the opposite has been found:

Here, we report a naturally occurring single nucleotide polymorphism in the human FAAH gene, 385A, that is strongly associated with street drug use and problem drug/alcohol use.

People with the mutant, A, version of the gene, the low-anxiety variant, were more likely to have drug problems.  In fact, even the study that found (weak) evidence for lower rates of marijuana dependence found much stronger evidence of higher rates of sedative dependence.

Simple, binary, genetic explanations for complex human conditions are always tempting, but usually wrong.

February 27, 2015

Quake prediction: how good does it need to be?

From a detailed story in the ChCh Press, (via Eric Crampton) about various earthquake-prediction approaches

About 40 minutes before the quake began, the TEC in the ionosphere rose by about 8 per cent above expected levels. Somewhat perplexed, he looked back at the trend for other recent giant quakes, including the February 2010 magnitude 8.8 event in Chile and the December 2004 magnitude 9.1 quake in Sumatra. He found the same increase about the same time before the quakes occurred.

Heki says there has been considerable academic debate both supporting and opposing his research.

To have 40 minutes warning of a massive quake would be very useful indeed and could help save many lives. “So, why 40 minutes?” he says. “I just don’t know.”

He says if the link were to be proved more firmly in the future it could be a useful warning tool. However, there are drawbacks in that the correlation only appears to exist for the largest earthquakes, whereas big quakes of less than magnitude 8.0 are far more frequent and still cause death and devastation. Geomagnetic storms can also render the system impotent, with fluctuations in the total electron count masking any pre-quake signal.

Let’s suppose that with more research everything works out, and there is a rise in this TEC before all very large quakes. How much would this help in New Zealand? The obvious place is Wellington. A quake over 8.0 magnitude has been observed in the area in 1855, when it triggered a tsunami. A repeat would also shatter many of the earthquake-prone buildings. A 40-minute warning could save many lives. It appears that TEC shouldn’t be that expensive to measure: it’s based on observing the time delays in GPS satellite transmissions as they pass through the ionosphere, so it mostly needs a very accurate clock (in fact, NASA publishes TEC maps every five minutes). Also, it looks like it would be very hard to hack the ionosphere to force the alarm to go off. The real problem is accuracy.

The system will have false positives and false negatives. False negatives (missing a quake) aren’t too bad, since that’s where you are without the system. False positives are more of a problem. They come in two forms: when the alarm goes off completely in the absence of a quake, and when there is a quake but no tsunami or catastrophic damage.

Complete false predictions would need to be very rare. If you tell everyone to run for the hills and it turns out to be sunspots or the wrong kind of snow, they will not be happy: the cost in lost work (and theft?) would be substantial, and there would probably be injuries.  Partial false predictions, where there was a large quake but it was too far away or in the wrong direction to cause a tsunami, would be just as expensive but probably wouldn’t cause as much ill-feeling or skepticism about future warnings.

Now for the disappointment. The story says “there has been considerable academic debate”. There has. For example, in a (paywalled) paper from 2013 looking at the Japanese quake that prompted Heki’s idea

A detailed analysis of the ionospheric variability in the 3 days before the earthquake is then undertaken, where a simultaneous increase in foF2 and the Es layer peak plasma frequency, foEs, relative to the 30-day median was observed within 1 h before the earthquake. A statistical search for similar simultaneous foF2 and foEs increases in 6 years of data revealed that this feature has been observed on many other occasions without related seismic activity. Therefore, it is concluded that one cannot confidently use this type of ionospheric perturbation to predict an impending earthquake.

In translation: you need to look just right to see this anomaly, and there are often anomalies like this one without quakes. Over four years they saw 24 anomalies, only one shortly before a quake.  Six complete false positives per year is obviously too many.  Suppose future research could refine what the signal looks like and reduce the false positives by a factor of ten: that’s still evacuation alarms with no quake more than once every two years. I’m pretty sure that’s still too many.


Siberian hamsters or Asian gerbils

Every year or so there is a news story along the lines of”Everything you know about the Black Death is Wrong”. I’ve just been reading a couple of excellent posts  by Alison Atkin on this year’s one.

The Herald’s version of the story (which they got from the Independent) is typical (but she has captured a large set of headlines)

The Black Death has always been bad publicity for rats, with the rodent widely blamed for killing millions of people across Europe by spreading the bubonic plague.

But it seems that the creature, in this case at least, has been unfairly maligned, as new research points the finger of blame at gerbils.

and

The scientists switched the blame from rat to gerbil after comparing tree-ring records from Europe with 7711 historical plague outbreaks.

That isn’t what the research paper (in PNAS) says. And it would be surprising if it did: could it really be true that Asian gerbils were spreading across Europe for centuries without anyone noticing?

The abstract of the paper says

The second plague pandemic in medieval Europe started with the Black Death epidemic of 1347–1353 and killed millions of people over a time span of four centuries. It is commonly thought that after its initial introduction from Asia, the disease persisted in Europe in rodent reservoirs until it eventually disappeared. Here, we show that climate-driven outbreaks of Yersinia pestis in Asian rodent plague reservoirs are significantly associated with new waves of plague arriving into Europe through its maritime trade network with Asia. This association strongly suggests that the bacterium was continuously reimported into Europe during the second plague pandemic, and offers an alternative explanation to putative European rodent reservoirs for how the disease could have persisted in Europe for so long.

If the researchers had found repeated, prevously unsuspected, invasions of Europe by hordes of gerbils, they would have said so in the abstract. They don’t. Not a gerbil to be seen.

The hypothesis is that plague was repeatedly re-imported from Asia (where affected a lots of species, including, yes, gerbils) to European rats, rather than persisting at low levels in European rats between the epidemics. Either way, once the epidemic got to Europe, it’s all about the rats [update: and other non-novel forms of transmission]

In this example, for a change, it doesn’t seem that the press release is responsible. Instead, it looks like progressive mutations in the story as it’s transmitted, with the great gerbil gradually going from an illustrative example of a plague host in Asia to the rodent version of Attila the Hun.

Two final remarks. First, the erroneous story is now in the Wikipedia entry for the great gerbil (with a citation to the PNAS paper, so it looks as if it’s real). Second, when the story is allegedly about the confusion between two species of rodent, it’s a pity the Herald stock photo isn’t the right species.


[Update: Wikipedia has been fixed.]

What are you trying to do?


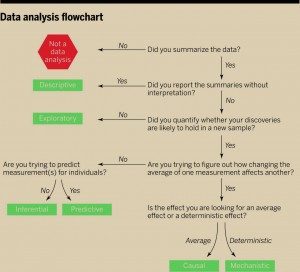
There’s a new ‘perspectives’ piece (paywall) in the journal Science, by Jeff Leek and Roger Peng (of Simply Statistics), arguing that the most common mistake in data analysis is misunderstanding the type of question. Here’s their flowchart

F1.large

The reason this is relevant to StatsChat is that you can use the flowchart on stories in the media. If there’s enough information in the story to follow the flowchart you can see how the claims match up to the type of analysis. If there isn’t enough information in the story, well, you know that.


February 25, 2015

Measuring what you care about

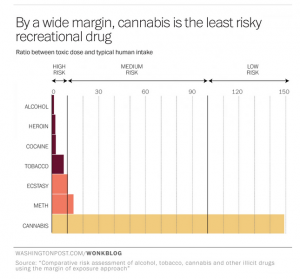
If cannabis is safer than thought (as the Washington Post says), that might explain why the reporting is careful to stay away from thought.

thought


The problem with this new research is that it’s looking at the acute toxicity of drugs — how does the dose people usually take compare to the dose needed to kill you right away.  It’s hard to overstate how unimportant this is in debates over regulation of alcohol, tobacco, and cannabis.  There’s some concern about alcohol poisoning (in kids, mostly), but as far as I can remember I have literally never seen anti-tobacco campaigns mentioning acute nicotine poisoning as a risk, and even the looniest drug warriors don’t push fatal THC overdoses as the rationale for banning marijuana.

Alcohol is dangerous not primarily because of acute poisoning, but because of car crashes, violence, cancer, liver failure, and heart damage. Tobacco is dangerous not primarily because of acute poisoning, but because of lung cancer, COPD, heart disease, stroke, and other chronic diseases.

It’s hard to tell how dangerous marijuana is. It certainly causes dependence in some users, and there are reasons to think it might have psychological and neurological effects. If smoked, it probably damages the lungs. In all these cases, though, the data on frequency and severity of long-term effects are limited.  We really don’t know, and the researchers didn’t even try to estimate.

The conclusions of the researchers — that cannabis is over-regulated and over-panicked-about relative to other drugs — are reasonable, but the data provide very little support for them.  If the researchers had used the same methodology on caffeine, it would have looked much more dangerous than cannabis, and probably more dangerous than methamphetamine. That would have been a bit harder to sell, even with a pretty graph.


[story now in Herald, too]