Posts filed under Research (206)

November 13, 2012

The light at the end of the tunnel

It’s the end of another semester, and we’re about to have a couple of days of presentations by our BSc(Hons) and MSc students, telling us what they’ve been doing all year:

Improving staffing schedules at a Cardiothoracic Intensive Care Unit

Clickers: A study of student opinion on audience response technology

Population modelling interactions between introduced and threatened species for conservation management 

Deal or No Deal

From question to design: Creating a guide for experimental planning and design in the biological sciences 

Balanced Incomplete Block Design in Multivariate Analysis

Use of multivariate omnibus test with mixed model analysis on heterogeneous nested data

Generalised Estimating Equations (GEEs) in the multivariate omnibus test

Web-based interactive graphics

Interactive Graphics for Data Quality Assessment

Creating an R meta-analysis graphics package

Monte Carlo Methods for Adjusting Confidence Intervals for Parameter of Point Process Models

Investigating if follow-up at outpatient clinics helps prevent adverse patient outcomes from Bowel Resection and Hip Replacement 

Methods of analysing hospital length of stay

Data management for combining data sets and macro simulation

Bootstrap methods in linear regression

Comparison of volatility estimates in Black-Scholes option pricing

Financial planning for retirees

A diagnostic for the Gaussian copula

Model Selection under Complex Sampling

BART vs Logistic regression: Propensity score estimation

Modelling and Prediction of Electricity Consumption

Brand attribute importance using choice elimination
November 12, 2012

The rise of the machines

The Herald has an interesting story on the improvements in prediction displayed last week: predicting the US election results , but more importantly, predicting the path of Hurricane Sandy.  They say

In just two weeks, computer models have displayed an impressive prediction prowess.

 The math experts came out on top thanks to better and more accessible data and rapidly increasing computer power.

It’s true that increasing computer power has been important in both these examples, but it’s been important in two quite different ways.  Weather prediction, use the most powerful computers that the metereologists can afford, and they are still nowhere near the point of diminishing returns.  There aren’t many problems like this.

Election forecasting, on the other hand, uses simple models that could even be run on hand calculators, if you were sufficiently obsessive and knowledgeable about computational statistics and numerical approximations.  The importance of increases in computer power is that anyone in the developed world has access to computing resources that make the actual calculations trivial.  Ubiquitous computing, rather than supercomputers, are what has revolutionised statistics.  If you combine the cheapest second-hand computer you can find with free software downloaded from the Internet, you have the sort of modelling resources that the top academic and industry research groups were just starting to get twenty years ago.

Cheap computing means that we can tackle problems that wouldn’t have been worthwhile before.  For example, in a post about the lottery, I wanted to calculate the probability that distributing 104 wins over 12 months would give 15 or more wins in one of the months.  I could probably work this out analytically, at least to a reasonable approximation, but it would be too slow and too boring to do for a blog post.  In less than a minute I could write code to estimate the probabilities by simulation, and run 10,000 samples.  If more accuracy was needed I could easily extend this to millions of samples.  That particular calculation doesn’t really matter to anyone, but the same principles apply to real research problems.

November 11, 2012

What do people tweet all day?

We saw the American Time Use Survey earlier this week, but a paper has just been published using a different source of publically-available time use data.

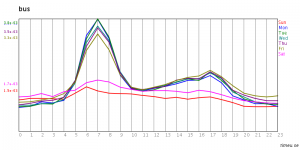
The site timeu.se collects information from Twitter and parses it to extract activities. For example: bus

On weekdays lots of people catch the bus in to work, and then teleport home. Or perhaps commuting home is just less tweet-worthy.

In any case, the data could be useful for picking up strong trends.  The new paper is about migraines, using time-of-day data from the website. The researchers found the expected differences between men and women, and between workdays and weekends/holidays, and the expected early morning peak, suggesting that tweet-mining at least isn’t completely bogus.

October 17, 2012

Consenting intellectual S&M activity

That’s how Ben Goldacre described the process of criticism and debate that’s fundamental to science, at a TED talk last year.  At this time of year we expose a lot of innocent young students to this process: yesterday it was the turn of statistical consulting course, next month it’s BSc(Hons) and MSc research projects, and then the PhD students.

Here’s Ben Goldacre’s whole talk


October 1, 2012

Computer hardware failure statistics

Ed Nightingale, John Douceur, and Vince Orgovan at Microsoft Research have analyzed hardware failure data from a million ordinary consumer PCs, using data from automated crash-reporting systems. (via)

Their main finding is that if something goes wrong with your computer, you should panic immediately, rather than being relieved when it seems to recover. Machines that accumulated at least 5 days full-time use over eight months had a 1/470 chance of a hard disk failure, but those that had one hard disk failure had a 30% chance of a second failure, and those with a second failure had nearly a 60% chance of a third failure.  Do you feel lucky?

It’s obvious that the set of computers that have a failure are basically doomed, but this still leaves open an interesting statistical question.  Does the risk of a second failure increase because the first failure damages the computer, or because the first failure picks out a set of computers that were always a bit dodgy?   I think the researchers missed something here: they tested for whether the times between failures have an exponential distribution (which is the distribution for events that don’t have any memory), and found that it didn’t.  That doesn’t distinguish between the situation where each computer has its own constant risk of failure, and the situation where each machine starts off the same but some of them have risk increasing over time.

For computers, it doesn’t matter very much which of these possibilities is true, but in some other contexts it does.   For example, if young people sent to prison are more likely to reoffend, we want to know whether the prison exposure was partly responsible, or whether these particular people were likely to reoffend anway. Unfortunately, this turns out to be hard.

July 16, 2012

Ewen Macdonald: (Vile) trial by opinion poll

This appeared on stuff.co.nz and in Fairfax papers last week:

After a harrowing trial that gripped the nation, a survey has revealed just one in five New Zealanders think Ewen Macdonald did not murder his brother-in-law Scott Guy.

A jury of 11 handed down a not guilty verdict to Macdonald, 32, last week, after a month-long trial in the High Court at Wellington.

But results to be made public by market research company UMR today show just 20 per cent of people surveyed agreed with Ewen Macdonald being acquitted of slaying Mr Guy outside his rural Feilding home in July 2010.

Living in New Zealand means agreeing to deal with criminal allegations transparently in the courtroom, not the court of (ill-informed, speculative) public opinion. The only people with the information on which to make an informed opinion are members of the jury – and they have delivered a verdict that police will not appeal.  What was UMR thinking?

July 4, 2012

Physicists using statistics

Traditionally, physics was one of the disciplines whose attitude was “If you need statistics, you should have designed a better experiment”.  If you look at the CERN webcast about the Higgs Boson, though, you see that it’s full of statistics: improved multivariate signal processing, boosted decision trees, random variations in the background, etc, etc.

Increasingly, physicists have found, like molecular biologists before them, and physicians before that, that sometimes you can’t afford to do a better experiment. When your experiment costs billions of dollars, you really have to extract the maximum possible information from your data.

As you have probably heard by now, CERN is reporting that they have basically found the Higgs boson: the excess production of certain sets of particles deviates from a non-Higgs model by 5 times the statistical uncertainty: 5σ.  Unfortunately, a few other sets of particles don’t quite match, so combining all the data they have 4.9σ, just below their preferred threshold.

So what does that mean?  Any decision procedure requires some threshold for making a decision.  For drug approval in the US, you need two trials that each show the drug is more effective than placebo by twice the statistical uncertainty: ie, two replications of 2σ, which works out to be a combined exceedance by 2.8 times the statistical uncertainty: 2.8σ.  This threshold is based on a tradeoff between the risk of missing a treatment that could be useful and the risk of approving a useless drug.  In the context of drug development this works well — drugs get withdrawn from the market for safety, or because the effect on a biological marker doesn’t translate into an effect on actual health, but it’s very unusual for a drug to be approved when it just doesn’t work.

In the case of particle physics, false positives could influence research for many years, so once you’ve gone to the expense of building the Large Hadron Collider, you might as well be really sure of the results.  Particle physics uses a 5σ threshold, which means that in the absence of any signal they have only a 1 in 30 million chance per analysis of deciding they have found a Higgs boson.    Despite what some of the media says, that’s not quite the same as a 1 in 30 million chance of being wrong: if nature hasn’t provided us with  a 125GeV Higgs Boson, an analysis that finds the result has a 100% chance of being wrong, if there is one, it has a 0% chance of being wrong.


Lazy scientific fraud

If you toss a coin 20 times, you will get 10 heads on average.  But if someone claims to have done this experiment 190 times and got exactly 10 heads of out 20 every single time they are either lying or a professional magician.

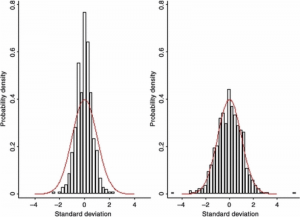
An anaesthesiology researcher, Yoshitaka Fujii, has the new record for number of papers retracted in scientific journals: 172 and counting. The fakery was uncovered by an analysis of the results of all his published randomized trials, showing that they had an unbelievably good agreement between the treatment and control groups, far better than was consistent with random chance.  For example, here’s the graph of differences in average age between treatment and control groups for Fujii’s trials (on the left) and other people’s trials (on the right), with the red curve indicating the minimum possible variation due only to chance.

The problem was pointed out more than ten years ago, in a letter to one of the journals involved, entitled “Reported data on granisetron and postoperative nausea and vomiting by Fujii et al. are incredibly nice!”  Nothing happened.  Perhaps a follow-up letter should have been titled “When we say ‘incredibly nice’, we mean ‘made-up’, and you need to look into it”.

Last year, Toho University, Fujii’s employer, did an investigation that found eight of the trials had not been approved by an ethics committee (because they hadn’t, you know, actually happened). They didn’t comment on whether the results were reliable.

Finally, the journals got together and gave the universities a deadline to come up with evidence that the trials existed, were approved by an ethics committee, and were reported correctly.  Any papers without this evidence would be retracted.

Statistical analysis to reveal fraud is actually fairly uncommon.  It requires lots of data, and lazy or incompetent fraud: if Prof Fujii had made up individual patient data using random number generators and then analysed it, there would have been no evidence of fraud in the results.   It’s more common  to see misconduct revealed by re-use or photoshopping of images, by failure to get ethics committee approvals, or by whistleblowers.  In some cases where the results are potentially very important, the fraud gets revealed by attempts to replicate the work.

June 28, 2012

Alpine fault: can we panic now?

The Herald has a good report of research to be published in Science tomorrow, studying earthquakes on the Alpine fault.  By looking at a river site where quakes disrupted water flow, interrupting peat deposition with a layer of sediment, the researchers could get a history of large quakes going back 8000 years. They don’t know exactly how big any of the quakes were, but they were big enough to rupture the surface and affect water flow, so at the least they would mess up roads and bridges, and disrupt tourism.

Based on this 8000-year history, it seems that the Alpine fault is relatively regular in how often it has earthquakes: more so than the San Andreas Fault in California, for example.  Since the fault has major earthquakes about every 330 years, and the most recent one was 295 years ago, it’s likely to go off soon.  Of course, ‘soon’ here doesn’t mean “before the Super 15 final”; the time scales are a bit longer than that.

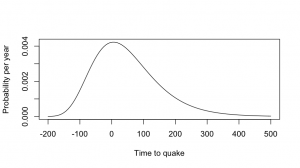
We can look at some graphs to get a rough idea of the risk over different time scales.  I’m going to roughly approximate the distribution of the times between earthquakes by a log-normal distribution, that is, the logarithm of the times has a Normal distribution.

This is a simple and reasonable model for time intervals, and it also has the virtue of giving the same answers that the researchers gave to the press.  Using the estimates of mean and variation in the paper, the distribution of times to the next big quake looks like the first graph.  The quake is relatively predictable, but “relatively” in this sense means “give or take a century”.
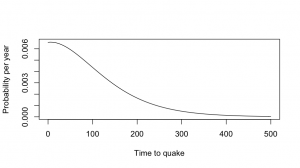
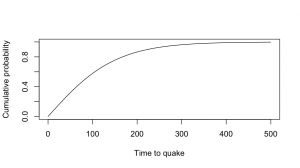
Now, by definition, the next big quake hasn’t happened yet, so we can throw away the part of this distribution that’s less than zero, and rescale the distribution so it still adds up to 1, getting the second graph.  The chance of a big quake is a bit less than 1% per year — not very high, but certainly worth doing something about.  For comparison, it’s about 2-3 times the risk per year of being diagnosed with breast cancer for middle-aged women.

The Herald article (and the press release) quote a 30% chance over 50 years, which matches this lognormal model.  At 80 years there’s a roughly 50:50 chance, and if we wait long enough the quake has to happen eventually.

The risk of a major quake in any given year isn’t all that high, but the problem isn’t going away and the quake is going to make a serious mess when it happens.


[Update: Stuff also has an article. They quote me  (via the Science Media Centre) , but I’m just describing one of the graphs in the paper: Figure 3B, if you want to go and check that I can do simple arithmetic]

May 4, 2012

Interesting (if not useful) genetics

Stuff has a story on a new genetic finding:  the cause of (naturally) blond hair in Melanesians, which turns out to be different from the cause in Europeans. You can read the full paper at Science (annoying free registration)

The researchers looked at DNA samples from 43 blond and 42 dark-haired Solomon Islanders. First, they looked at a grid of DNA markers that are relatively easy and cheap to measure.  This pointed out a region of the genome that differed between the blond and dark-haired groups.  The region contained just one gene, so they were then able to determine the complete genetic sequence of the gene in 12 people from each group.  This led to a single genetic change that was a plausible candidate for causing the difference, which the team then measured in all 85 study participants, confirming that it did determine hair color.

The result is interesting, but not all that useful. The gene responsible was already known to be involved in hair and skin color, in humans and in other animals, so that didn’t provide anything new, and if you want to find out or change someone’s hair colour, there are easier ways.  Still, it’s interesting that blond hair has appeared (at least) twice — most traits with multiple independent origins are more obviously useful, like being able to digest milk as an adult, or being immune to malaria.

This general approach of a wide scan of markers and then follow-up sequencing is being used by other groups, including a consortium I’m involved in.  Although it worked well for the hair-color gene, it’s a bit more difficult to get clear results for less dramatic differences in things like blood pressure. Fortunately, we have larger sample sizes to work with, so there’s some chance.   We’re hoping that finding the specific genetic mechanisms behind some of the differences will provide leverage for opening up more understanding of how heart disease and aging work.  If we’re lucky.