Posts filed under Research (206)

December 13, 2012

Meet Glenn Thomas – Statistics Summer Scholarship recipient

This summer, we have a number of fantastic students who received a Department of Statistics scholarship to work on fascinating projects with our staff members. We’ll be profiling them here on Stats Chat and we’d love to hear your feedback on their projects!

Glenn Thomas is working with Alan Lee, Ilze Ziedins and Geoff Pritchard on a research project entitled ‘Statistical modelling of telecommunications sector challenges.’

Glenn Thomas Statistics Scholarship Recipient 2012-2013 Glenn explains:

“My project is unique as it is not a traditional project. Instead, I’m doing an internship at Harmonic, a company that provides custom business analytics and software tools to businesses, partnering with various universities including The University of Auckland. Harmonic provides solutions to companies primarily in the telecommunications, energy, and agriculture industries. In particular, I am working on projects in the telecommunications industry and I am also exploring how to deal with big data in R.

“One of the projects I have been working on is an asset life-cycle solution for Telecom New Zealand. The PTSN (Public Switched Telephone Network) is a fundamental asset for Telecom, and Harmonic’s asset-management analytics ensures it runs efficiently by providing monthly information updates to support spares management, failure analysis, disaster recovery and life-cycle planning. My role has been to improve the speed of some of the processes used in the analysis by optimising existing R code and developing custom functions.

“Another project I have been working on in the same industry is SNA (social network analysis), which is the analysis of social networks to deliver customer insight. One of the challenges I am facing is dealing with the large amount of data. Harmonic uses R to deliver statistical solutions, but one of the difficulties in R is working with very large datasets. I’ve been looking into various packages and methods of handling big data in R, and applying it to social network analysis.”

More about Glenn:

“I’ve just completed my third year of a conjoint degree in commerce and science. I know it sounds like an odd combination at first, but I have found the subjects to be quite complementary. My commerce major is finance, and my science majors are statistics and applied mathematics. I chose these subjects initially since I was good at them and enjoyed them at school. But more recently, I have particularly enjoyed the problem-solving side of statistics. That’s what I love about statistics; everything you learn is applicable to solving real-world problems.

“Outside of study, I enjoy getting outdoors and doing some hiking and camping. I recently walked the Hillary Trail, a 70km hike in the WaitakereRanges. I also enjoy water-skiing during the summer. I enjoy investigating the latest technology and, of course, spending time with my family and friends.”
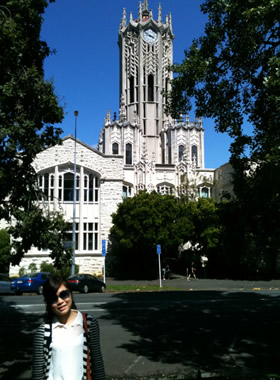
December 12, 2012

Meet Huan Lin – Statistics Summer Scholarship recipient

This summer, we have a number of fantastic students who received a Department of Statistics scholarship to work on fascinating projects with our staff members. We’ll be profiling them here on Stats Chat and we’d love to hear your feedback on their projects!

Huan Lin is working with Chris Triggs and Pat Riddle (Computer Science) on a research project entitled ‘How many clusters are there, really?’

Huan Lin Statistics Scholarship Recipient 2012-2013 Huan explains:

“Initially, I’m working with two data sets with known properties to compare and contrast distance metrics and clustering algorithms both directly and in presence of noise.

“After this I will work with data sets of mixtures of categorical, binary and continuous variables where there are no predefined clusters. Then, I will investigate clustering algorithms in R and Weka to compare and contrast results. I will be writing R functions to generate datasets with known properties that can be applied to a variety of scenarios.

“At the end of the project, I am expected to become a confident R programmer to write R functions effectively and efficiently.”

More about Huan:

“I am currently in my final year of a BA and BCom conjoint degree, majoring in statistics and accounting. I enjoy learning and exploring statistics because it is a useful tool for us to better understand the world we live in. In addition, statistics provides me with many practical skills that are transferable in a variety of fields, which would be my competitive edge in the workforce.

I also enjoy playful Zumba classes for their music and rhythm. Over the summer, I also plan to study a bit of philosophy and, of course, have some time off to spend with my family and friends.”

December 11, 2012

Meet Kimberley Eccles – Statistics Summer Scholarship recipient

This summer, we have a number of fantastic students who received a Department of Statistics scholarship to work on fascinating projects with our staff members. We’ll be profiling them here on Stats Chat and we’d love to hear your feedback on their projects!

Kimberley Eccles is working with Maxine Pfannkuch and Stephanie Budgett on statistics education research.

Kimberley Eccles - Statistics Scholarship Recipient 2012-2013 Kimberley explains:  

“This summer I am working on a statistics education research project. The researchers wish to introduce some new ideas into the statistics curriculum to aid students’ understanding of some of the big ideas of statistics. Matched pre- and post-tests have been conducted to gauge levels of understanding before and after the concepts are taught.

“Another summer scholarship student and I have been given the task of reading through the test answers to ascertain and report on the level of understanding displayed. We are also identifying and reporting on common misconceptions amongst the students, so that these can be addressed and corrected in future developments of the curriculum.

“We will also be analysing interviews conducted with students using nVivo. These provide a greater ability to investigate the reasoning behind answers that students give to questions, giving a much clearer picture of which ideas are not being properly understood.

“Overall, the project is providing us with an excellent exposure to qualitative data in a way not frequently encountered by students of statistics.”

More about Kimberley:

“I am studying a conjoint degree in law and arts, with a major in statistics. This is usually considered an unusual combination – particularly given that I have no desire to practice law, and intend to teach high-school maths when I graduate.

“I am particularly interested in statistics education because I believe that all too often students are turned off statistics (and math) because of the way that these subjects are taught in school. I see this as quite a tragedy, as the analysis and critical thinking that the subjects ought to teach are extremely important for development and engagement in society.

“More relevantly to my law degree, I have a developing interest in mediation, and alongside my research project I am also training (as a reserve) for an international mediation competition. I hope to combine my interests in education and mediation at some point in the future.”

December 10, 2012

Meet Joshua Dale – Statistics Summer Scholarship recipient

This summer, we have a number of fantastic students who received a Department of Statistics scholarship to work on fascinating projects with our staff members. We’ll be profiling them here on Stats Chat and we’d love to hear your feedback on their projects!

Joshua Dale is working with David Scott on sports prediction.

Joshua Dale - Statistics Scholarship Recipient 2012-2013 Joshua explains:

“David Scott has been predicting the outcome of rugby union and rugby league games using an exponential smoothing method. The predictions have been posted on Stats Chat and his Super 15 predictions have also appeared in the New Zealand Herald. Whilst the predictions have been quite successful and David was equal best amongst the NZ Herald tipping panel in predicting Super 15 games in 2012, it is likely that the method can be improved.

“The project will investigate some possible improvements:

  1. The use of more parameters for home-game advantage;
  2. The use of a power transform of the prediction errors used for updating team ratings;
  3. Adaptive estimation of the smoothing parameter.

“If time permits, the problem of automatic updating of fixture lists from websites will also be considered. The data analysis and optimisation will be primarily carried out using the statistical programming language R. I have taken a couple of computer science papers and I use R a fair bit in statistics courses, which will be a big help with this project.”

More about Joshua:

“I’m just about to finish a Bachelor of Commerce degree where I majored in finance, but also studied several statistics papers as well, enough to gain entry into the Bachelor of Science (Honours) programme in statistics for 2013. During 2012, I had the opportunity to work for the Department of Statistics, both marking assignments and tutoring in the computer labs. This has been an incredibly worthwhile experience, and I plan to do it again next year.

“As a lab demonstrator, students ask you for help with concepts and assignments. I feel because the tutors in the labs are students themselves, they are able to explain concepts in a way that the students can relate to, which makes their learning experience much more enjoyable.

“I like statistics because of its applicability to a huge number of problems. In almost any situation where data is involved, statistics can be used to increase efficiency, improve profitability, make predictions, and help to provide insight into many other areas. It’s also reassuring, in terms of job prospects, that with the heavy use of computers and the internet today, corporations are collecting more data than ever before. Somebody’s got to analyse it!

“In addition to focusing on this project, over summer I will be learning how to program in SAS (a major commercial statistics package), studying for the CFA (Chartered Financial Analyst) exams, and trying to find undervalued stocks to buy on the New Zealand and Australian stock markets. You’ll also find me mountain biking on the weekends, building a petrol-powered bike in the garage, and heading to the Coromandel for New Year.”

December 7, 2012

Meet Liza Bolton – Statistics Summer Scholarship recipient 2012-2013

This summer, we have a number of fantastic students who received a Department of Statistics scholarship to work on fascinating projects with our staff members. We’ll be profiling them here on Stats Chat and we’d love to hear your feedback on their projects!

Liza Bolton is working with Mark Holmes on an interactive simulation of interacting particle systems.

Liza Bolton - Statistics Scholarship Recipient 2012-2013 Of the scholarship, Liza says:

“I am delighted to have this opportunity over the summer, as I’m in love with mathematics and statistics (my two majors in a Bachelor of Science) and was keen to sink my teeth into learning Java. The opportunity to solve problems, sometimes completely abstract, and sometimes with very relevant practical importance, has always drawn me to these subjects. I’ve just completed the second year of my BSc and hope to go on to Honours after my undergrad, before working for a while, and then probably finding my way back to further study.”

Liza explains what the research project is about:

“Imagine you’re on a balcony, looking down on a crowded public square. Below you there’s a sort of multi-party political expo going on. The east wall has a line of Labour Party supporters against it. There are National Party supporters lined up against the west wall, and a line of Green Party supporters on the north wall.

“Do you have that picture in your head? Now, these people lining the walls of the square are never going to change their mind about who they want to vote for. But next, imagine that all the other people in the square (it’s absolutely packed, people are shoulder to shoulder) are far more malleable in their political views. In fact, each person might change their opinion based on the people around them. To stretch the allegory just a little, you can tell that all this is happening from your perch up on the balcony because people are wearing coloured hats to show their party choice, and change to a hat of their new party’s colour when they change their mind.

“Now, political opinion is more complicated than the scenario above, but I hope this might help you picture the actual process of what I’m getting up to this summer. I’m working on creating an interactive simulation of interacting particle systems with Dr Mark Holmes.

“Instead of people, in a square, with peculiar party-appropriate headwear, think instead of a grid with each square (or particle) in the grid a colour. In each time step, one of the squares in the grid is randomly selected to change colour, based on the colours of the squares with an edge adjacent to it. If a blue square is going to change in a particular time step, and has two red and two green squares next to it, it is with probability 0.5 that it will change to green, and likewise to red. And just as with the people you can choose to line the sides of the grid with squares that will not change colour.

The goal for this research is:

“To create a Java applet that people can interact with online that exhibits this idea and also communicates what is going on in a way that will be widely accessible. By the end people will be able to play with this applet, select the colour and position of invariant squares however they like, and watch the system progress through time. Hopefully, it will be a fun little way to create patterns and watch them form, and allow for a basic introduction to the complex and fascinating world of interacting particle systems.”

When Liza’s not going square-eyed staring at grids this summer …

“… I’ll be wearing the hat of Chief Operations Officer for P3 Foundation, a completely youth-lead non-governmental organisation working to empower Kiwi youth to eradicate extreme poverty in the Asia-Pacific. I’ll be doing a bit of work for Teach First NZ, an organisation working to tackle educational inequality in New Zealand, and the family holiday programme at the Voyager Maritime Museum, too. And of course, eating ice cream, reading good books, watching Vlogbrothers and hanging out with my lovely whānau.”

November 22, 2012

Are old apes really happier?

Prompted by a comment from Cosma Shalizi (who, irritatingly, is right as usual), I tried some simulated data on the great ape midlife crisis, and I’m now even less impressed with the paper.

There’s very strong evidence in the paper that the youngest apes are rated as happier by their handlers, and that the relationship with age is not linear.  What’s less clear is that there is a U-shape.

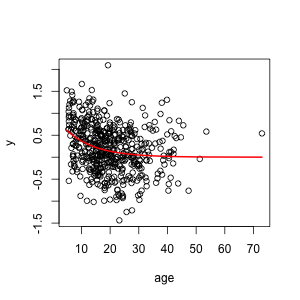
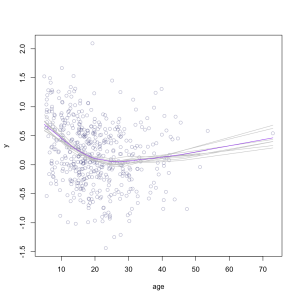
I simulated data where the score decreased sharply at young ages and then flattened out, but didn’t go up again in old age, and analysed as the researchers did in the paper.  This is what the data and true relationship look like:

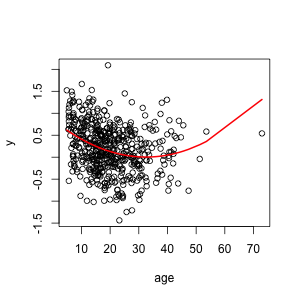
Fitting the model used in the research paper gives a U-shape, because the model they fitted can only give U-shapes. As in the paper, the minimum is in middle life.  The statistical significance for the non-linear term is better than in the paper.

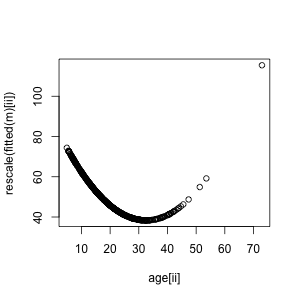
In the paper, the fitted U-shape was rescaled to have mean 50 and standard deviation 10, and the raw data weren’t displayed, making the relationship look much stronger:

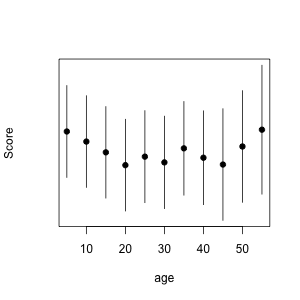
And, as in the paper, the banded model in the Appendix is at least consistent with a U-shape.

So, you can get the results in the paper with no midlife crisis at all. Now, you don’t necessarily get results like these: if you run the code with different sets of random numbers you get results this good maybe half the time. And of course, you could also get those results with a true U-shape.

The point is that the results in the paper are not strong evidence for a U-shape, and the graphs and tables in the paper give the impression of much stronger evidence than they actually contain.  A much better graph would use a scatterplot smoother, to draw a curve through the data objectively, and something like bootstrap replicates of the curve to give a real impression of uncertainty.  This doesn’t give a formal test, but at least it shows what the data are saying.

It would take some thought to come up with a good formal test, but a graph like this one should be a minimum threshold. If there really is evidence of a midlife crisis in apes this graph would show it, and if there isn’t, it wouldn’t. (more…)

November 21, 2012

Not so much poor and huddled masses

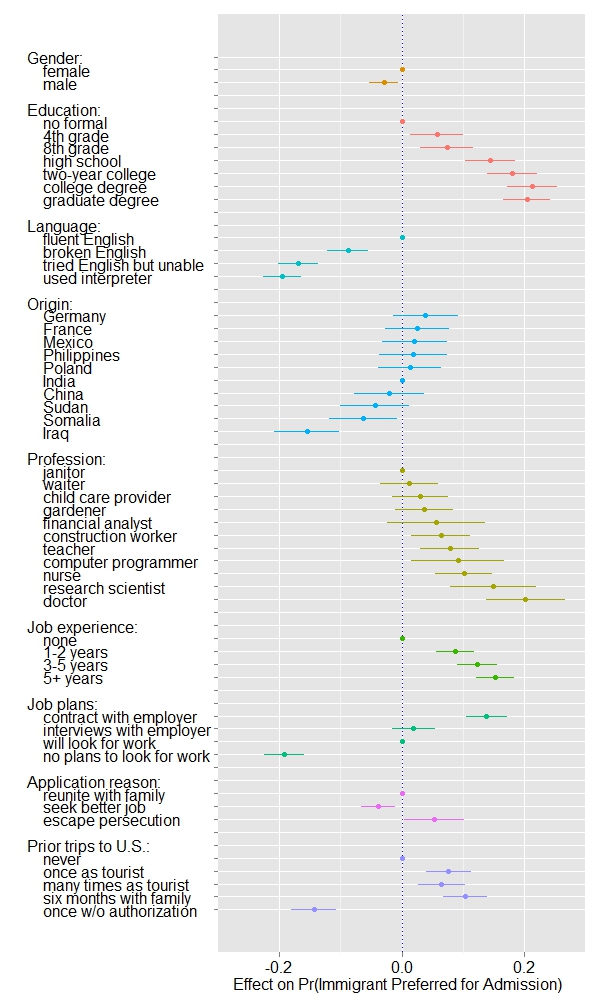
Nice presentation of interesting results on US opinions of immigration.  Participants were given two hypothetical immigrants with characteristics chosen from these options, and asked which one they would prefer to admit, and regression models were then used to estimate the impact of each characteristic.   Country of origin had a surprisingly small impact; otherwise it was pretty much what you might expect.  The story has more details, including a comparison by political affiliation, which reveals almost no disagreement.

While on the topic, you should read Eric Crampton’s proposal that anyone completing a (sufficiently real) degree in NZ should be eligible for permanent residence: not only boosting our education export industry, but attracting young, ambitious, educated immigrants. I think it’s a good idea, but I’m obviously biased.

November 20, 2012

Avoiding midlife uncertainty

Stuff and the Herald have the identical AP story, so you can read either one

Chimpanzees in a midlife crisis? It sounds like a setup for a joke. But there it is, in the title of a report published in a scientific journal: ‘Evidence for a midlife crisis in great apes.

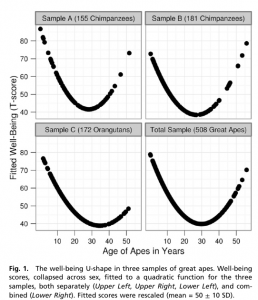
The researchers asked handlers to estimate ‘well-being’ for 508 great apes: 172 orang-utans, the rest, chimpanzees.  They fitted a statistical model to look for a decrease in mid-life followed by an increase, and got dramatic graphs

The x-axis is in years, showing the trough of despondency in the mid-thirties.  The y-axis isn’t in anything — the curves were rescaled to look similar and the numbers are arbitrary.

The reason the curves look so dramatic is partly the higher-than-wide shape of the graph, but mostly the lack of any indication of uncertainty. The data are actually consistent with a wide range of flatter or steeper U-shapes and with the `mid-life’ crisis happening anywhere over quite a range of years.  I can’t be more precise than that, because the researchers don’t even provide the necessary information to compute the uncertainty in the curve [they give uncertainties in regression coefficients, but not correlations between them].

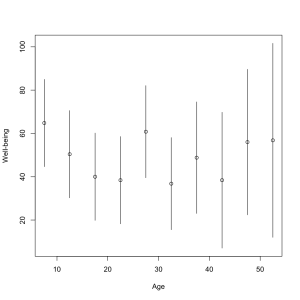
However, they do have an appendix that looks at chopping up age into five-year bands and estimating the midlife crisis that way.  They don’t give a graph, but they do give enough information to draw one. It’s not as impressive.

The U-shaped pattern does seem to probably be real (though the extent to which the so-called mid-life crisis is really the apes’ problem rather than than the handlers’ problem isn’t clear), but the graphs in the research paper are overselling it. Badly.

[Update: the intervals in the plot are +/- 1.4 standard errors for the coefficient. This should be in the ballpark for a 95% interval for the mean for that age group]

November 16, 2012

Screening anticancer compounds: how it’s really done

I’ve commented a number of times about stories in the papers where researchers have, basically, dripped herbal tea on cancer cells in a Petri dish and found it killed them (the cells, not the researchers).  Screening anticancer compounds this way does work, it’s just that it doesn’t work very often, and when it does work it’s just the first step of years of likely failure.

Derek Lowe, at In The Pipeline, writes today about a research paper looking for things that might kill cancer stem cells.  These are a tiny fraction of cells in a tumour, but are thought to be responsible for a lot of the treatment resistance and relapse.  The researchers couldn’t work with actual cancer stem cells, which aren’t available in large quantities, so they used imitations produced by gene knockout. They screened 300 000 compounds from a large collection maintained by the National Institutes of Health.  About 3000 killed the imitation stem cells.  They then threw out all the compounds known to be highly toxic to normal cells, and those that repeatedly show up in screens for interesting properties.  The problem with the latter group is that either they cheat (ie, they interfere with the assays being used) or they really do so many different things that they probably won’t be practical tools.

Of the remaining 2200 compounds that killed the imitation stem cells, nearly all of them also killed the original cancer cells that didn’t have the gene knockout, so however they might work it’s probably nothing useful for cancer stem cells.  Finally, they rechecked the results with independent samples of the compounds (since if you have a collection of 300 000 compounds, no matter how careful you try to be, they aren’t all going to be what they say on the tin).

After all of this, they ended up with two compounds that appear to be selectively toxic against cancer stem cells.  These aren’t drugs, even potentially, but they should be useful for finding out more about the biological differences in cancer stem cells and that, in turn, may lead to new treatments.

November 14, 2012

Up or down

The Herald (from the Daily Mail, sadly) has a headline “Baby girls exposed to stress have great risk of teen anxiety”.  “How great?”, you ask. They don’t say.

We do learn:

Teenage girls are more likely to struggle with anxiety and depression if they’re exposed to stress as babies, a study has found.

If you go to look at either the abstract, or the more comprehensible explanation in Nature News, you find that this isn’t quite right

The study showed that 18-year-old girls who had had high cortisol levels at age 4 have weak connectivity between the amygdala, a deep nub of the brain known for processing fear and emotions, and the ventromedial prefrontal cortex, an outer region involved in curbing the amygdala’s stress response.

But without taking cortisol into account, early stress, in itself, is not significantly correlated with the differences in brain activity seen at age 18…

The study also found that girls who have higher scores on anxiety tests have weaker synchrony between these two regions than do girls with lower scores. Intriguingly, the opposite pattern was found for depressive symptoms: higher depression scores correlate with stronger connectivity.

Or, in the original Greek

For females, adolescent amygdala-vmPFC functional connectivity was inversely correlated with concurrent anxiety symptoms but positively associated with depressive symptoms,

Nothing about the opposite findings for anxiety and depression made it into the story. If you go on to read the full article, you also find that while they measured early life stress and they measured symptoms of adolescent anxiety and depression, they don’t report on the associations between them.  The analysis is about how the other variables related to the brain wave patterns.   At least, for a change, the gender differences in the story are supported by the research.

The research is actually quite interesting and potentially useful, and the correlations between cortisol levels and brain waves are respectably strong.  Much stronger, for example, than the link between the results and the headline and lead in the story.