Posts filed under Research (206)

April 17, 2013

Drawing the wrong conclusions

A few years ago, economists Carmen Reinhart and Kenneth Rogoff wrote a paper on national debt, where they found that there wasn’t much relationship to economic growth as long as debt was less than 90% of GDP, but that above this level economic growth was lower.  The paper was widely cited as support for economic strategies of `austerity’.

Some economists at the University of Massachusetts attempted to repeat their analysis, and didn’t get the same result.  Reinhart and Rogoff sent them the data and spreadsheets they had used, and it turns out that the analysis they had done didn’t quite match the description in the paper.  Part of the discrepancy was an error in an Excel formula that accidentally excluded a bunch of countries, but Reinhart and Rogoff also deliberately excluded some countries and times that had high growth and high debt (including Australia and NZ immediately post-WWII), and gave each country the same weight in the analysis regardless of the number of years of data included. (paper — currently slow to load, summary by Mike Konczal)

Some points:

  • The ease of making this sort of error in Excel is exactly why a lot of statisticians don’t like Excel (despite its other virtues), so that has received a lot of publicity.
  • Reinhart and Rogoff point out that they only claimed to find an association, not a causal relationship, but they certainly knew how the paper was being used, and if they didn’t think provided evidence of a causal relationship they should have said something a lot earlier. (I think Dan Davies on Twitter put it best)
  • Chris Clary, who is a PhD student at MIT, points out that the first author (Thomas Herndon) on the paper demonstrating the failure to replicate is also a grad student, and notes that replicating things is job often left to grad students.
  • The Reinhart and Rogoff paper wasn’t the primary motivation for, say,  the UK Conservative Party to want to cut taxes and government spending. The Conservatives have always wanted to cut taxes and government spending. Cutting taxes and spending is a significant part of their basic platform. The paper, at most, provided a bit of extra intellectual cover.
  • The fact that the researchers handed over their spreadsheet pretty much proves they weren’t deliberately deceptive — but it’s a lot easy to convince yourself to spend a lot of time checking all the details of a calculation when you don’t like the answer than when you do.

Roger Peng, at  Johns Hopkins, has also written about this incident. It would, in various ways, have been tactless for him to point out some relevant history, so I will.

The Johns Hopkins air pollution research group conducted the largest and most comprehensive study of health effects of particulate air pollution, looking at deaths and hospital admissions in the 90 largest US cities.  This was a significant part of the evidence used in setting new, stricter, air pollution standards — an important and politically sensitive topic, though a few order of magnitude less so than austerity economics.  One of Roger’s early jobs at Johns Hopkins was to set up a system that made it easy for anyone to download their data and reproduce or vary their analyses. The size of the data and the complexity of some of the analyses meant just emailing a spreadsheet to people was not even close to acceptable.

Their research group became obsessive (in a good way) about reproducibility long before other researchers in epidemiology.  One likely reason is a traumatic experience in 2002, when they realised that the default settings for the software they were using had led to incorrect results for a lot of their published air pollution time series analyses.  They reported the problem to the EPA and their sponsors, fixed the problem, and reran all the analyses in a couple of weeks; the qualitative conclusions fortunately did not change.  You could make all sorts of comparisons with the economists’ error, but that is left as an exercise for the reader.
 

April 11, 2013

Power failure threatens neuroscience

A new research paper with the cheeky title “Power failure: why small sample size undermines the reliability of neuroscience” has come out in a neuroscience journal. The basic idea isn’t novel, but it’s one of these statistical points that makes your life more difficult (if more productive) when you understand it.  Small research studies, as everyone knows, are less likely to detect differences between groups.  What is less widely appreciated is that even if a small study sees a difference between groups, it’s more likely not to be real.

The ‘power’ of a statistical test is the probability that you will detect a difference if there really is a difference of the size you are looking for.  If the power is 90%, say, then you are pretty sure to see a difference if there is one, and based on standard statistical techniques, pretty sure not to see a difference if there isn’t one. Either way, the results are informative.

Often you can’t afford to do a study with 90% power given the current funding system. If you do a study with low power, and the difference you are looking for really is there, you still have to be pretty lucky to see it — the data have to, by chance, be more favorable to your hypothesis than they should be.   But if you’re relying on the  data being more favorable to your hypothesis than they should be, you can see a difference even if there isn’t one there.

Combine this with publication bias: if you find what you are looking for, you get enthusiastic and send it off to high-impact research journals.  If you don’t see anything, you won’t be as enthusiastic, and the results might well not be published.  After all, who is going to want to look at a study that couldn’t have found anything, and didn’t.  The result is that we get lots of exciting neuroscience news, often with very pretty pictures, that isn’t true.

The same is true for nutrition: I have a student doing a Honours project looking at replicability (in a large survey database) of the sort of nutrition and health stories that make it to the local papers. So far, as you’d expect, the associations are a lot weaker when you look in a separate data set.

Clinical trials went through this problem a while ago, and while they often have lower power than one would ideally like, there’s at least no way you’re going to run a clinical trial in the modern world without explicitly working out the power.

Other people’s reactions

April 10, 2013

What genetics is good for

There’s an article in Nature News about one of the most interesting findings from large-scale genomic studies.  People with mutations in a gene called PCSK9 have low levels of cholesterol, and since the protein produced by that gene is active outside cells, it is relatively easy to target.  Also, people with mutations in both of their copies of the PCSK9 gene seem to be healthy, so it looks as though it should be a safe target for treatment

Synthetic antibodies against PCSK9 reduced LDL (bad) cholesterol by 73% in initial trials in a small group of patients, which is huge. There’s a huge trial going on at the moment to see if this translates to a reduction in heart attacks, strokes, etc.  It could still easily fail — several other drugs giving big cholesterol improvements have turned out not to prevent heart disease — but it is very promising.

April 8, 2013

Briefly

  • Interesting post on how extreme income inequality is. The distribution is compared to a specific probability model, a ‘power law’, with the distribution of earthquake sizes given as another example. Unfortunately, although the ‘long tail’ point is valid, the ‘power law’ explanation is more dubious.   Earthquake sizes and wealth are two of the large number of empirical examples studied by Aaron Clauset, Cosma Shalizi, and Mark Newman, who find the power law completely fails to fit the distribution of wealth, and is not all that persuasive for earthquake sizes. As Cosma writes

If you use sensible, heavy-tailed alternative distributions, like the log-normal or the Weibull (stretched exponential), you will find that it is often very, very hard to rule them out. In the two dozen data sets we looked at, all chosen because people had claimed they followed power laws, the log-normal’s fit was almost always competitive with the power law, usually insignificantly better and sometimes substantially better. (To repeat a joke: Gauss is not mocked.)


April 1, 2013

Briefly

Despite the date, this is not in any way an April Fools post

  • “Data is not killing creativity, it’s just changing how we tell stories”, from Techcrunch
  • Turning free-form text into journalism: Jacob Harris writes about an investigation into food recalls (nested HTML tables are not an open data format either)
  • Green labels look healthier than red labels, from the Washington Post. When I see this sort of research I imagine the marketing experts thinking “how cute, they figured that one out after only four years”
  • Frances Woolley debunks the recent stories about how Facebook likes reveal your sexual orientation (with comments from me).  It’s amazing how little you get from the quoted 88% accuracy, even if you pretend the input data are meaningful.  There are some measures of accuracy that you shouldn’t be allowed to use in press releases.
March 31, 2013

Briefly

Easter trading rules don’t appear to forbid blogging today, so a few links

  • Using words like “common”, “uncommon”, “rare”, “very rare” to describe risks of drug side-effects is recommended by guidelines,  and patients like it better than numbers, but it leads to serious overestimation of the actual risks (PDF poster, via Hilda Bastian)
  • A map of gun deaths in the US since the Sandy Hook shootings
  • Stuff’s small-business section says: “Scientists believe the Kiwifruit virus Psa came to New Zealand in a 2009 shipment of flowers.” I hope it’s just the newspaper, not the scientists, that thinks Psa is a virus
  • Another story about petrol prices in the Herald, linked to remind you all that the government collects and publishes data.  You can find it, even if AA, the petrol companies, and the media can’t.  This time AA seems to be right: the importer margin is about 4c above the trend line, which itself is up 5c on last year.
March 19, 2013

How could this possibly go wrong?

There’s a new research paper out that sequences the genome of one of the most important cancer cell lines, HeLa.  It shows the fascinating genomic mess that can arise when a cell is freed from the normal constraints against genetic damage, and it gives valuable information about a vital research resource.

However, the discussion on Twitter (or at least the parts I frequent) has been dominated by another fact about the paper.  The researchers apparently didn’t consult at all with the family of Henrietta Lacks, the person whose tumour this originally was.  There are two reasons this is bad.

Firstly, publishing a genome of  an ancestor of yours allows people to learn a lot about your genome. The high levels of mutation in the cancer cell line reduces this information a bit, but there’s still a lot there. As a trivial example, even without worrying about genetic disease risks, you could use the data to tell if someone who thought they were a descendant of Ms Lacks actually was or wasn’t. Publishing a genome without consent from, or consultation with, anyone is at best rude.

And secondly: come on, guys, didn’t you read the book? From the author’s summary

In 1950, Henrietta Lacks, a young mother of five children, entered the colored ward of The Johns Hopkins Hospital to begin treatment for an extremely aggressive strain of cervical cancer. As she lay on the operating table, a sample of her cancerous cervical tissue was taken without her knowledge or consent and given to Dr. George Gey, the head of tissue research. Gey was conducting experiments in an attempt to create an immortal line of human cells that could be used in medical research. Those cells, he hoped, would allow scientists to unlock the mysteries of cancer, and eventually lead to a cure for the disease. Until this point, all of Gey’s attempts to grow a human cell line had ended in failure, but Henrietta’s cells were different: they never died.

Less than a year after her initial diagnosis, Henrietta succumbed to the ravages of cancer and was buried in an unmarked grave on her family’s land. She was just thirty-one years old. Her family had no idea that part of her was still alive, growing vigorously in laboratories—first at Johns Hopkins, and eventually all over the world.

That’s how they did things back then.  It’s not how we do things now. If there was a symbolically worse genome to sequence without some sort of consultation, I’d have a hard time thinking of it.

I don’t think anyone’s saying laws or regulations were violated, and I’m not saying that the family should have had veto power, but they should at least have been talked to.

Another dimension for graphics

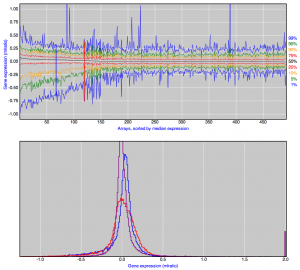
We’ve encountered Karl Broman before, for his list of the top ten worst graphs in the scientific literature.  He also has some nice examples of interactive scientific graphics, both stand-alone and embedded in slides for talks.

One example: 500 boxplots of gene expression ratios (no, you don’t need to know or care what these are).  The top panel shows minimum, maximum, median, quartiles, and as you move the mouse along, the bottom panel shows the whole distribution.  Click, and the distribution stays in the bottom panel for comparison with others.

boxplots


Karl, on Twitter, has also recommended a column on visualisation in the journal Nature Methods, but it’s not open-access, sadly.

March 5, 2013

They think they are representing you

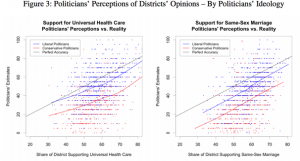
An interesting finding from the US (via):  politicians think their electorates are more conservative than they actually are — slightly more conservative for left-wing politicians, much more conservative for right-wing ones.

broockman_graph


The errors are large: right-wing politicians overestimate the support among their electorate for conservative positions by an average of nearly 20%.  The size of the error, and the big differences by ideology of the politician mean that it can’t just be explained by actual voters being more conservative than the population at large.

February 25, 2013

Economic data mining needs theory

Via the new Observational Epidemiology blog, it is possible to talk about stochastic complexity in reasonably plain English