Posts filed under Research (206)

July 23, 2013

Research provenance (just link, already)

The Herald has a story about high rates of depression in young Australian men, which gives very little information about what the data was like and where it came from.  Often that’s a sign that the people who came up with the numbers would really prefer you not know how they did it.

In this case, though, the research is from a well-designed  survey with computer-based interviewing of people chosen by dialling random telephone numbers, and there’s a detailed description of the research program and a glossy but carefully-written and informative report (PDF) available.


July 13, 2013

Visualising the Bechdel test

The Bechdel Test classifies movies according to whether they have two female characters, who at some point talk to each other, about something other than a man.

It’s not that all movies should pass the test — for example, a movie with a tight first-person viewpoint is unlikely to pass the test if the viewpoint character is male, and no-one’s saying such movies should not exist.  The point of the test is that surprisingly few movies pass it.

At Ten Chocolate Sundaes there’s an interesting statistical analysis of movies over time and by genre, looking at the proportion that pass the test.  The proportion seems to have gone down over time, though it’s been pretty stable in recent years.

July 12, 2013

Is this a record?

In what may be the least accurate risk estimate ever published in a major newspaper, the Daily Mail said last week

  • Hormone replacement could cause meningioma in menopausal women
  • Those using HRT for a decade have a 70% chance of developing a tumour
  • Most are benign but 15% are malignant and all have damaging side effects

You don’t actually need to look up any statistics to know this is wrong, just ask yourself how many women you know who had brain surgery. Hormone replacement therapy was pretty common (until it was shown not to prevent heart disease), so if 70% of women who used it for a decade ended up with meningioma, you’d know, at a minimum, several women who had brain surgery for cancer.  Do you?

In fact, according to the British NHS, the lifetime risk of meningioma is about 0.07%. Since it’s more common in women, that might be as much as 0.1% lifetime risk for women. The research quoted by the Mail actually found a relative risk of 1.7, so the lifetime risk might be up to 0.17% in women who take a decade of hormone replacement therapy. That is, the story overestimates the risk by 69.8 percentage points, or a factor of more than 400.

While this may be a record so far, there’s still room for improvement, and I certainly wouldn’t bet on the record standing for ever.

(via @hildabast and @BoraZ on Twitter, and Paul Raeburn of the MIT science journalism program)

July 5, 2013

Email metadata

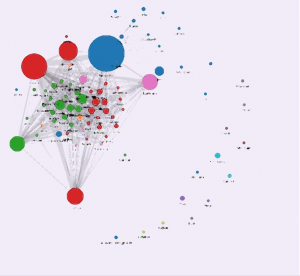
Some folks at the MIT Media Lab have put together a simple web app that takes your Gmail headers and builds a social network.

Once you log in, Immersion will use only the From, To, Cc and Timestamp fields of the emails in the account you are signing in with. It will not access the subject or the body content of any of your emails.

Here’s mine, from my University of Washington email (with the names blurred, not that communicating with me is all that incriminating)

immersion


Obviously my email headers reveal who I email, and, unsurprisingly, the little outlying clusters are small groups or individuals involved in specific projects.  More interesting is how the main clump breaks down:  the blue and pink circles are statisticians, the red are epidemiology and genomics people that I have worked with in person in Seattle, and the green are epidemiology and genomics people that I work with only via email.

July 2, 2013

Triggering the Alltrials campaign

The New York Times has a detailed story about one of the triggers for the Alltrials campaign, the missing studies of Tamiflu

He was curious about one of the main studies on which Dr. Jefferson had relied in his previous analysis. Called the Kaiser study, it pooled the results of 10 clinical trials. But Dr. Hayashi noticed that the results of only two of those trials had been fully published in medical journals. Given that details of eight trials were unknown, how could the researchers be certain of their conclusion that Tamiflu reduced risk of complications from flu?

Only about half of all randomized clinical trials are published, despite regulations requiring publication, and the requirements of the Declaration of Helsinki

Authors have a duty to make publicly available the results of their research on human subjects and are accountable for the completeness and accuracy of their reports.

Since the obvious conclusion is that the unpublished studies are less favorable than the published ones, patients and the medical community cannot be sure about the benefits of even the most promising treatments.  The uncertainty always matters at least to a small group of patients, but in the case of Tamiflu it matters to the whole world. The 2009-2010 influenza pandemic was relatively minor, but still killed more than 250000 people worldwide (by most estimates, more than the Iraq war). The 1918 pandemic was at least twenty times worse. Before it happens again, we need to know which treatments work and which do not work.

June 27, 2013

Guide to reporting clinical trials

From the World Conference of Science Journalists, via @roobina (Ruth Francis), ten tweets on reporting clinical trials

  1. Was this #trial registered before it began? If not then check for rigged design, or hidden negative results on similar trials.
  2. Is primary outcome reported in paper the same as primary outcome spec in protocol? If no report maybe deeply flawed.
  3. Look for other trials by co or group, or on treatment, on registries to see if it represents cherry picked finding
  4. ALWAYS mention who funded the trial. Do any of ethics committee people have some interest with the funding company
  5. Will country where work is done benefit? Will drug be available at lower cost? Is disorder or disease a problem there
  6. How many patients were on the trial, and how many were in each arm?
  7. What was being compared (drug vs placebo? Drug vs standard care? Drug with no control arm?
  8. Be precise about people/patient who benefited – advanced disease, a particular form of a disease?
  9. Report natural frequencies: “13 people per 10000 experienced x”, rather than “1.3% of people experienced x”
  10. NO relative risks. Paint findings clearly: improved survival by 3%: BAD. Ppl lived 2 months longer on average: GOOD

Who says you can’t say anything useful in 140 characters?

Hand-washing study awash in misunderstanding …


The New York Times has reported on a study in which observers sat discreetly in bathrooms and observed whether people “properly” washed their hands (I reckon it would be quite hard to sit discreetly in a bathroom unless you’re in a cubicle). Anyway, the description of the study gave careful attention to the stats: 10.3% of women and over 15 percent of men didn’t wash at all. Of those who did wash, 22.8% did not use soap. And only 5.8% washed for more than 15 seconds.

The lead author said, “Forty-eight million people a year get sick from contaminated food, and the (American) Centre for Communicable Diseases says 50% would not have gotten sick if people had washed their hands properly. Do as your mum said: Wash your hands.”

Surely there’s some basic confusion over percentages here: 50% of those who got sick wouldn’t have if everyone had washed their hands properly, but we have no idea what percentage of those who don’t wash actually get sick.

As a matter of fact, there is no indication that these particular non-handwashers have anything to do at all with the fact that people eat contaminated food. Does it matter what bathroom activity was being carried out? Whether you use toilet paper or your foot to flush? Whether you work in food services? Whether you subsequently wash your hands before eating dinner?

Though mum may have had good advice, this sort of scare-mongering about food-borne illnesses resulting from not washing one’s hands may actually distract us from the real concerns over germs.

  • Read the full analysis by Rebecca Goldin, here. She is Director of Research for STATS, an American non-profit, non-partisan service that  helps journalists think quantitatively through providing education, workshops and direct assistance with data analysis.
June 13, 2013

What you can learn by mining metadata

Kieran Healy uses data from the time of the American Revolution to show how membership of organisations can be turned into social network information

Rest assured that we only collected metadata on these people, and no actual conversations were recorded or meetings transcribed. All I know is whether someone was a member of an organization or not. Surely this is but a small encroachment on the freedom of the Crown’s subjects. I have been asked, on the basis of this poor information, to present some names for our field agents in the Colonies to work with. It seems an unlikely task.

If you want to follow along yourself, there is a secret repository containing the data and the appropriate commands for your portable analytical engine.


You may well already have seen this, but I’ve been travelling.

June 4, 2013

Survey respondents are lying, not ignorant

At least, that’s the conclusion of a new paper from the National Bureau of Economic Research.

It’s a common observation that some survey responses, if taken seriously, imply many partisans are dumber than a sack of hammers.  My favorite example is the 32% of respondents who said the Gulf of Mexico oil well explosion made them more likely to support off-shore oil drilling.

As Dylan Matthews writes in the Washington Post, though, the research suggests people do know better. Ordinarily they give the approved politically-correct answer for their party

In the control group, the authors find what Bartels, Nyhan and Reifler found: There are big partisan gaps in the accuracy of responses. …. For example, Republicans were likelier than Democrats to correctly state that U.S. casualties in Iraq fell from 2007 to 2008, and Democrats were likelier than Republicans to correctly state that unemployment and inflation rose under Bush’s presidency.

But in an experimental group where correct answers increased your chance of winning a prize, the accuracy improved markedly:

Take unemployment: Without any money involved, Democrats’ estimates of the change in unemployment under Bush were about 0.9 points higher than Republicans’ estimates. But when correct answers were rewarded, that gap shrank to 0.4 points. When correct answers and “don’t knows” were rewarded, it shrank to 0.2 points.

This is probably good news for journalism and for democracy.  It’s not such good news for statisticians.
May 29, 2013

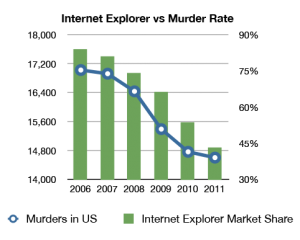
Two graphs, three trends

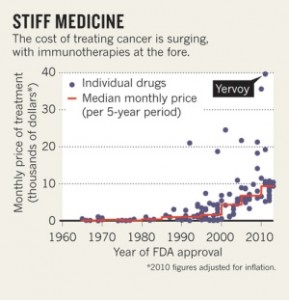
First, the serious one.  Nature News has a story about new immune-based cancer treatments (like Herceptin for breast cancer), some of which are very effective, but which are increasingly expensive.  In contrast to previous `small molecule’ drugs, these won’t necessarily get cheap when the patent runs out, since generic  (technically, `biosimilar’) versions are harder to make and test.

ASCO-cancer-graph


Now for something completely different

iemurder


By @altonncf — via various people on Twitter who don’t cite original sources. Pro tip: Google Image Search is quite good at finding originals.