Posts filed under Research (206)

December 30, 2013

Diversification

There’s a story on NPR news about college advertising brochures.

Pippert and his researchers looked at more than 10,000 images from college brochures, comparing the racial breakdown of students in the pictures to the colleges’ actual demographics. They found that, overall, the whiter the school, the more diversity depicted in the brochures, especially for certain groups.

When you look at the research paper it turns out that’s not quite right. The main data table (Table 3) is

diversity

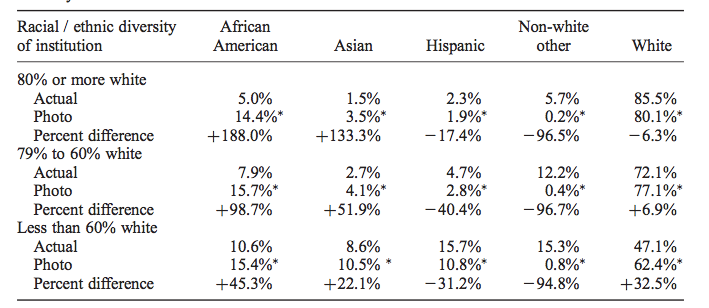
What it shows is that the proportion of African-American students in photos in the brochure is actually pretty much constant, regardless of the proportion at the university. It’s the exaggeration that increases for whiter campuses.  It would have been nice to see this in a graph (and also perhaps see White+Asian pooled), but sociology doesn’t routinely do graphs (Kieran Healy has a paper trying to get them to)

Interestingly, the 15% or so proportion of African-American students in photos is above the proportion in the population as a whole (12.4%), but is very close to the proportion in the 16-19 age band, which includes the target audience for these brochures. That may well be just a coincidence, since there’s enough geographical variation that basically no-one is exposed to what the US population proportion looks like.

December 27, 2013

Meet Tania Tian, Statistics Summer Scholar 2013-2014

Every year, the Department of Statistics at the University of Auckland offers summer scholarships to a number of students so they can work with our staff on real-world projects. We’ll be profiling the 2013-2014 summer scholars on Stats Chat. Tania is working with Dr Stephanie Budgett on a project titled First-time mums: Can we make a difference?

Tania (right) explains:Tania Tian

“This project is based on the ongoing levator ani study (LA, commonly known as the pelvic floor muscles) from the Pelvic Floor Research Group at the Auckland Bioengineering Institute (ABI), which looks at how the pelvic floor muscles change after first-time mums give birth.

“The aim is to see whether age, ethnicity, delivery conditions and other related factors are associated with the tearing of the muscle. Interestingly, the stiffness of the muscle at rest has been identified as a key factor and is being measured by a specially designed device, an elastometer, that was built by engineers at the ABI.

“Pelvic-floor muscle injury following a vaginal delivery can increase the risks for prolapse where pelvic organs, such as the uterus, small bowl, bladder and rectum, descend and herniate. Furthermore, the muscle trauma may also promote or intensify urinary and/or bowel incontinence.

“Not only do these pelvic- floor disorders cause discomfort and distress, and reduce the mother’s quality of life, and, if left untreated, may lead to major health concerns later in life. Therefore, a statistical model based on key factors elucidated from the study may aid health professionals in deciding the best strategy for delivering a woman’s baby and whether certain interventions are needed.

“I have recently completed my third year of a Bachelor of Science majoring in Statistics and Pharmacology and intend to pursue postgraduate studies. I hope to integrate my knowledge of medical sciences and statistics and specialise in medical statistics.

“Statistics appeals to me because it is a useful field with direct practical applications in almost every industry. I had initially taken the stage one paper as a standalone in order to broaden my knowledge, but eventually realised that I really liked the subject and that it could complement whichever career I have. That’s when I decided to major in statistics, and I’m very glad that I did.

“Over this summer, aside from the project, I am hoping to spend more time with friends and family – especially with my new baby brother! I am also looking forward to visiting the South Island during the Christmas break.”


December 6, 2013

Reports about young women and binge-drinking: a caution

Local media have been proclaiming that younger women are binge-drinking themselves into oblivion, (examples here and here),  many of these stories leaning on Canadian journalist and recovering alcoholic Ann Dowsett Johnston’s book Drink: The Intimate Relationship Between Women and Alcohol.  She says the percentage of college students who binge drink, using the measure of consuming five or more drinks in one sitting, was nearly 45% in 2011, and repeated this in a recent Wall Street Journal item called The New Face of Risky Drinking is Female.

However, there is an editor’s note at the bottom of her piece (that probably should be at the top), pointing out that Johnston got her compelling  figure by combining the results  of two separate studies carried out in different years.

The  non-profit, non-partisan Statistical Assessment Service (STATS) in the US points out that a basic tenet of Statistics 101 is that one should never directly compare survey results that come from different populations or that were provided from surveys taken with different methods, even if the surveys are angling for the same kind of data.  Surveys can return different results for a variety of reasons, from the time of year in which they are administered, to the population from which participants are chosen, and even to how the questions are asked. In this case, it says, both surveys  have systematic biases that come from their survey methods, which in turn makes direct comparisons problematic. See its useful analysis of the situation here.


November 29, 2013

Roundup retraction

I’ve written before about the Seralini research that involved feeding glyphosate and GM corn to rats. Now, Retraction Watch is reporting that the paper will be retracted.

This is a slightly unusual retraction: typically either the scientist has a horrible realisation that something went wrong (maybe their filters were affecting composition of their media) or the journal has a horrible realisation that something went wrong (maybe the images were Photoshopped or the patients didn’t actually exist).

The Seralini paper, though, is being retracted for being kinda pointless. The editors emphasise that they are not suggesting fraud, and write

A more in-depth look at the raw data revealed that no definitive conclusions can be reached with this small sample size regarding the role of either NK603 or glyphosate in regards to overall mortality or tumor incidence. Given the known high incidence of tumors in the Sprague-Dawley rat, normal variability cannot be excluded as the cause of the higher mortality and incidence observed in the treated groups.

Ultimately, the results presented (while not incorrect) are inconclusive, and therefore do not reach the threshold of publication for Food and Chemical Toxicology. 

They’re certainly right about that, but this is hardly a new finding. I’m not really happy about retraction of papers when it isn’t based on new information that wasn’t easily available at the time of review. Too many pointless and likely wrong papers are published, but this one is being retracted for being pointless, likely wrong, and controversial.


[Update: mass enthusiasm for the retraction is summarised by Peter Griffin]

November 27, 2013

Overselling genetics

From the Herald, under the headline “Could you have the binge drinking gene?

It’s long been known that a penchant for alcohol may be in the genes, and scientists say they may now be a step closer to understanding why.

They have found that a faulty gene may cause binge drinking – and that mice with the mutation overwhelmingly prefer the taste of alcohol to water.

This story is from the Daily Mail again; the Herald’s own reporters write better medical science stories.

In fact, the research is looking at mice to see the effect of mutating one of the genes encoding something called the GABA-A receptor. There’s some genetic evidence that differences in this gene are related to alcohol dependence (not binge drinking, which isn’t the same thing) in humans, and the researchers are interested in how the effect might work. They say

Our understanding of the genetic and molecular basis of alcohol dependence is incomplete. Alcohol abuse has long been associated with facilitation of neurotransmission mediated by the brain’s major inhibitory transmitter, GABA, acting via GABAA receptors (GABAARs). Recently, a locus within human chromosome 4, containing GABAAR subunit genes… associated with alcohol dependence in humans. … However, the neurobiological basis by which genetic variation translates into alcohol abuse is largely unknown.

This research into how the genetic differences might work is interesting and has potential applications in treatments for addiction, but we know that variants in this particular gene predict almost nothing about alcohol dependence in humans. That’s typical in modern large-scale genetics: genetic variants common enough to study in large numbers of people usually have very small effects, and they are important because they provide tiny points of light illuminating the complex biological mechanisms of health and disease.

You can get another useful bit of context by searching on “binge drinking gene”

  • Daily Mail, March 2011: It has long been believed that alcoholism runs in the family – now scientists have pinpointed why. They have identified a binge-drinking gene, offering new hope in combating the growing social problem, it was revealed today.
  • Daily Mail, December 2012:  A newly discovered addiction gene could be fuelling teenage binge-drinking, research suggests. The mutant version of the RASGRF2 gene makes the brain more sensitive to habit-forming rewards such as alcohol, studies have shown.

We were clearly due for identifying the binge drinking gene again about now. But if you want to know if you are at risk of binge drinking, counting your drinks will be much more informative than measuring your genes.

How statistics can help cure cancer

Well, one of the ways.

Professor Terry Speed, an Australian statistician and geneticist, who gave public lectures in New Zealand this year as the Royal Society of New Zealand’s Distinguished Speaker, recently won the (Australian) Prime Minister’s Science Prize.

BBC News Magazine has an interview with him.

November 19, 2013

Tune in, turn on, drop out?

From online site Games and Learning

A massive study of some 11,000 youngsters in Britain has found that playing video games, even as early as five years old, does not lead to later behavior problems.

This is real research, looking at changes over time in a large number of children and it does find that the associations between ‘screen time’ and later behaviour problems are weak. On the other hand, the research paper concludes

 Watching TV for 3 h or more at 5 years predicted a 0.13 point increase (95% CI 0.03 to 0.24) in conduct problems by 7 years, compared with watching for under an hour, but playing electronic games was not associated with conduct problems.

When you see “was not associated”, you need to look carefully: are they claiming evidence of absence or just weakness of evidence. Here are the estimates in a graphical form, comparing changes in a 10-point questionnaire about conduct.

video


The data largely rule out average differences as big as half a point, so this study does provide evidence there isn’t a big impact (in the UK). However, it’s pretty clear from the graph that the data don’t provide any real support for a difference between TV and videogames.  The estimates for TV are more precise, and for that reason the TV estimate is ‘statistically significant’ and the videogames one isn’t, but that’s not evidence of difference.

It’s also interesting  that there’s mild support in the data for ‘None’ being worse than a small amount. Here the precision is higher for the videogame estimate, because there are very few children who watch no TV (<2%).

November 12, 2013

Memorable data visualisations

From phys.org

With Harvard students Azalea A. Vo and Shashank Sunkavalli, as well as MIT graduate students Zoya Bylinskii and Phillip Isola, the team designed a large-scale study—in the form of an online game—to rigorously measure the memorability of a wide variety of visualizations. They collected more than 5,000 charts and graphics from scientific papers, design blogs, newspapers, and government reports and manually categorized them by a wide range of attributes. Serving them up in brief glimpses—just one second each—to participants via Amazon Mechanical Turk, the researchers tested the influence of features like color, density, and content themes on users’ ability to recognize which ones they had seen before

The researchers talk about what features were present in the more-memorable graphs, which tended to be visually dense and not to be of standard forms.

It’s good to see empirical evaluation of theories about graphics. However, as they admit,  ‘memorable’ may not be the right criterion. Even if it isn’t ‘memorable’ in the eyeball-bleach sense, memorability may not be a good proxy for informativeness.

This is your sampling on drugs

From Stuff, this morning

This year, and for the first time in New Zealand, Fairfax Media is partnering with the Global Drug Survey to help create the largest and most up-to-date snapshot of our drug and alcohol use, and to see how we compare to the rest of the world.

That all sounds good. The next line (with a link) is

Take the survey here.

That doesn’t sound so good.

This research group has been running a survey in partnership with UK clubbing magazine Mixmag for years, and last year branched out to ‘Global’ status with the help of the Guardian. Not all that global, though: more than half the respondents were from the UK, with half of the rest from the US.  As you might expect, the respondents were more likely to be from demographic groups with high drug use: overrepresented attributes included young, male, student, and gay or bi.   The research team and their expert advisory committee includes experts in a wide range of areas needed to design and interpret a study of this sort, with one exception: they don’t seem to have a statistician.

What are the results going to be useful for? Clearly, any estimates of prevalence of drug use will be pretty much useless if the survey oversamples drug users as it has in the past. Comparisons with past surveys done by different methods will be completely useless.  International comparisons within the survey will be a bit dodgy, since the newspapers taking part will reach different segments of each country– readers of the Fairfax media are quite a different subpopulation than Guardian readers

Useful information is more likely to be obtained on drug prices, on subjective experience of drug taking, on harm people experience from different drugs, and on comparison between drugs: eg, among people who’ve tried both MDMA and cocaine, which do they keep using and why?  In countries where there is no high-quality survey information, the semi-quantitative information about drug use might be helpful, but that’s probably not true for NZ or the USA.  Certainly for alcohol use, the NZ Health Survey would be more reliable, and the estimates of street price  of drugs from Massey’s IDMS should be pretty good.

For New Zealand, the most useful outcome would be if the survey provokes a repeat of the NZ Alcohol and Drug Use Survey, which was run in 2007-2008.

[Update: the NZ Health Survey was planned to have a drug use module in 2012. I can’t find any confirmation that it actually happened, or any planned release date for the data.  See the comments. The module was administered and data will appear next year. So, it’s definitely not true that there hasn’t been an NZ survey since 2007/8, contrary to the story]

October 22, 2013

Cookies not as addictive as cocaine

Sometimes a scientific claim is obviously unreasonable, like when a physicist tells you “No, really, the same electron goes through both slots in this barrier”. You’re all “Wut? No. Can’t be.” They show you the interference pattern. “But did you think of…?” “Yes”. “Couldn’t it be..” “No, we tried that.” “But…”  “And that.”  “Still, what about…?” “That too.” Eventually you give up and accept that the universe is weird. An electron really can go through two holes at once.

On the other hand, sometimes the claim isn’t backed up that well, like when Stuff tells us “Cookies as addictive as cocaine”. For example, while some rats were given Oreo cookies and others were given cocaine, there weren’t any rates who were offered both, so there wasn’t any direct evaluation of preference, let alone of addiction. The cookies weren’t even compared to the same control as the cocaine — cookies were compared to rice cakes, and cocaine-laced water to plain water.

There’s a more detailed take-down on the Guardian site, by an addiction researcher.