Posts filed under Research (206)

March 4, 2014

What you do know that ain’t so

From a randomised trial of four different sets of information about vaccine benefits (via Brendan Nyhan)

Parents were randomly assigned to receive 1 of 4 interventions: (1) information explaining the lack of evidence that MMR causes autism from the Centers for Disease Control and Prevention; (2) textual information about the dangers of the diseases prevented by MMR from the Vaccine Information Statement; (3) images of children who have diseases prevented by the MMR vaccine; (4) a dramatic narrative about an infant who almost died of measles from a Centers for Disease Control and Prevention fact sheet; or to a control group.

In particular, intervention 4 is a popular and sensible idea, and it has occurred to people from Benjamin Franklin to Kiwi parents and the Herald. However:

RESULTS: None of the interventions increased parental intent to vaccinate a future child. Refuting claims of an MMR/autism link successfully reduced misperceptions that vaccines cause autism but nonetheless decreased intent to vaccinate among parents who had the least favorable vaccine attitudes. In addition, images of sick children increased expressed belief in a vaccine/autism link and a dramatic narrative about an infant in danger increased self-reported belief in serious vaccine side effects.

This research is depressing from the point of view of science communication. The problem is that the message goes in two apparently opposite ways.  One conclusion is that increasing trust in science and medicine is the only solution, which would require more public contact and communication, and openness about uncertainty.  The other conclusion is that a public health advertising campaign is a treatment, and like any other treatment it should be evaluated for safety and effectiveness before it’s applied to the population, an approach that seems to imply a reduction in open and unfiltered communication.

I don’t think the contradiction is unavoidable; I think more communication about research process — who are we and what do we actually do — will help, but also that advertising, whether government-funded or pushed by PR departments, is actually dangerous.  If we overstate claims about the biochemical effects of compounds in chocolate, or the number of deaths prevented by lowering the blood alcohol limit, why should we be trusted on important issues?
 

February 26, 2014

Caricatures in music space

There’s a map going around Twitter, being described as the most popular band in each US state


It’s a bit surprising that every state has a different favourite band, so I looked at the site listed on the map as the source.  In fact, the listed bands are not the most popular ones in any of the states. They are something more interesting.

Paul Lamere used Spotify (and perhaps other social music-streaming services) to get music listening preferences for 200000 people. He then looked at which artist in the top 100 for a state had the worst ranking over the US as a whole. He forced the result to be different for every state by bumping the less-populous state to its next choice when there was a tie. So, as the title on the map actually says, these are the most distinctive bands for a state, not the most popular.  They are caricatures, not photographs.

Since he had data based on postal code (ZIP code), it’s a pity he grouped these all the way up to the state level.  It would have been interesting to see urban vs suburban vs rural differences, and the major geographical trends across states such as Texas.

February 17, 2014

Two charts about animal use in research

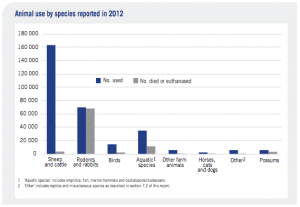
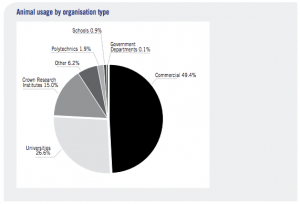
Prompted by Siouxsie Wiles’s report of talking to an anti-vivisectionist demonstrator, here are two charts from the annual report of the National Animal Ethics Advisory Committee. These are the people who monitor the use of animals in research, testing, and teaching in New Zealand.

The first chart shows what types of animals are used and what happens to them afterwards

animal-bar

More than half are sheep and cattle, mostly cattle, and mostly subjected to things like breeding or eating different types of feed.  There are quite a lot of mice used in biological research, though the numbers are decreasing (down 24% last year) partly because they are being replaced by zebrafish. None are monkeys.

About half of the research is commercial, with about a quarter at universities

animal-pie

Some people will still be opposed to livestock research because they’re opposed to livestock farming. Some people still  disapprove of the use of mice in biomedical research. But anyone who wants to campaign on those issues should be clear that those are the issues.

February 14, 2014

Interpreted with caution

There’s a new paper in The Lancet, summarising population-based surveys across the world that asked about non-partner sexual violence. The paper’s conclusion, from the abstract

Sexual violence against women is common worldwide, with endemic levels seen in some areas, although large variations between settings need to be interpreted with caution because of differences in data availability and levels of disclosure.

The story in Stuff has the headline Sexual assaults more than double world average, and starts

The rate of sexual assault in Australia and New Zealand is more than double the world average, according to a new report.

After several highly publicised rapes and murders of young women in India and South Africa, researchers from several countries  decided to review and estimate prevalence of sexual violence against women in 56 countries.

The results, published in the UK medical journal The Lancet, found that 7.2 per cent of women aged 15 years or older  reported being sexually assaulted by someone other than an intimate  partner at least once in their lives.

The study found that Australia and New Zealand has the third-highest rate, more than double the world average, with 16.4  per cent.

If you look at the raw numbers reported in the paper, they showed Australia/NZ at about ten times the rate of the Caribbean or southern Latin America or Eastern Europe, which is really not plausible. Statistical adjustment for differing types of survey reduced that margin, but as the researchers explicitly and carefully point out, a lot of the variation between regions could easily be due to variations in disclosure, and it suggests that rape is being underestimated in some areas.

As usual with extreme international comparisons, the headline is both probably wrong and missing the real point. The real point is that roughly one in six women in Australia & NZ report having experienced sexual violence.

February 13, 2014

Commuting costs are housing costs

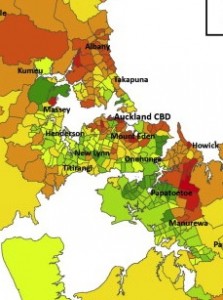
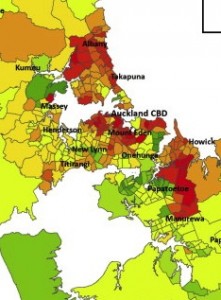
There’s an interesting story in the Herald about research on the combined cost of commuting and housing in Auckland.

“If you just look at housing costs alone, outlying areas appear really affordable and it initially seems to make sense to say, hey, let’s open up greenfield sites on the urban periphery and develop here,” Mr Mattingly said. “But when you include these broader costs, they are not as affordable as they seem.”

This is the sort of conclusion I like to see, as a non-driver, so I looked at the research paper (there wasn’t a link, but the Herald did give the researchers’ names and journal name). I was disappointed that the impact of commuting costs wasn’t higher, at least until you got out to Pukekohe or Warkworth.

Since the journal is published by a company known for its dedication to preventing knowledge being disseminated for free, I won’t show any whole maps, but here are the central chunks of the cost maps with and without commuting costs. Or perhaps the other way around.


January 17, 2014

Hard-to-survey populations

As we saw a few weeks ago with the unexpectedly high frequency of virgin births, it can be hard to measure rare things accurately in surveys, because rare errors will crowd out the true reports. It’s worse with teenagers, as a new paper from the Add Health study has reported. The paper is not open-access, but there’s a story in MedicalXpress.

So imagine the surprise and confusion when subsequent revisits to the same research subjects found more than 70 percent of the self-reported adolescent nonheterosexuals had somehow gone “straight” as older teens and young adults.

“We should have known something was amiss,” says Savin-Williams. “One clue was that most of the kids who first claimed to have artificial limbs (in the physical-health assessment) miraculously regrew arms and legs when researchers came back to interview them.”

This wasn’t just data-entry error, and it probably wasn’t a real change; after some careful analysis they conclude it was a mixture of genuine misunderstanding of the question (“romantic” vs “sexual” attraction), and, well, teenagers. Since not many teens are gay (a few percent), it doesn’t take many incorrect answers to swamp the real data.

It doesn’t matter so much that the number of gay and bisexual teenagers was overestimated. The real impact is on the analysis of health and social development in this population.  In Add Health and at least one other youth survey, according to the researchers, this sort of error has probably led to overestimating the mental and physical health problems of non-heterosexual teenagers.

January 15, 2014

Fancy packaging of plain packaging impact

The Sydney Morning Herald has a story on the impact of plain packaging for cigarettes in Australia.  Cancer researchers in Sydney found a big spike in calls to Quitline after the packaging change, and interpreted this as evidence it was working

The researchers said although the volume of calls to Quitline was an ”indirect” measure of people’s quitting intentions and behaviour, it was more objective than community surveys where people can answer questions in a socially desirable and biased way.

On the other side, tobacco companies say there hasn’t been any actual fall in smoking.

”In November 2013, a study by London Economics found that since the introduction of plain packaging in Australia there has been no change in smoking prevalence … What matters is whether fewer people are smoking as a result of these policies – and the data is clear that overall tobacco consumption and smoking prevalence has not gone down,” he said.

In this setting you might reasonably be concerned that either side is putting their results in fancy packaging. So what should you believe?

In fact, the claims are consistent with each other and don’t say much either way about the success of the program.  If you look at the research paper, they found an increase peaking at about 300 calls per week and then falling off by about 14% per week. That works out to be a total of roughly 2000 extra calls attributed to the packaging change, ie, just over half a percent of all smokers in Australia, or perhaps a 10% increase in the annual Quitline volume. If the number of people actively trying to quit by methods other than Quitline also goes up by 10%, you still wouldn’t expect to see much impact on total tobacco sales after one year.

The main selling point for the plain packaging (eg) was that it would prevent young people from starting to smoke. That’s what really needs to be evaluated, and it’s probably too early to tell.


[Update: Of course, other countries that were independently considering changing their policies shouldn’t wait for years just because Australia started first. That would be silly.]

[Update: the Quitline data are just for NSW; so perhaps 1.5% of smokers]

January 14, 2014

The dangers of better measurement

An NPR News story on back pain and its treatment

One reason invasive treatments for back pain have been rising in recent years, Deyo says, is the ready availability of MRI scans. These detailed, color-coded pictures that can show a cross-section of the spine are a technological tour de force. But they can be dangerously misleading.

This MRI shows a mildly herniated disc. That's the sort of thing that looks abnormal on a scan but may not be causing pain and isn't helped by surgery.

This MRI shows a mildly herniated disc. That’s the sort of thing that looks abnormal on a scan but may not be causing pain and isn’t helped by surgery.

“Seeing is believing,” Deyo says. “And gosh! We can actually see degenerated discs, we can see bulging discs. We can see all kinds of things that are alarming.”

That is, they look alarming. But they’re most likely not the cause of the pain.

Health food research marketing

The Herald has a story about better ways to present nutritional information on foods

“Our study found that those who were presented with the walking label were most likely to make healthier consumption choices, regardless of their level of preventive health behaviour,” Ms Bouton said.

“Therefore, consumers who reported to be unhealthier were likely to modify their current negative behaviour and exercise, select a healthier alternative or avoid the unhealthy product entirely when told they would need to briskly walk for one hour and 41 minutes to burn off the product.

“The traffic light system was found to be effective in deterring consumers from unhealthy foods, while also encouraging them to consume healthy products.”

This sounds good. And this is a randomised experiment, which is an excellent feature.

However, it’s just an online survey of 591 people, about a hypothetical product, so what it actually found was that the labelling system was effective in deterring people from saying they would buy unhealthy foods, encouraging them to say they would consume healthy products and made them more likely to say they would exercise. That’s not quite so good. It’s a lot easier to get people to say they are going to eat better, exercise more, and lose weight that to get them to actually do it.

Another interesting feature is that this new research has appeared on the Herald website before. In October 2012 there was a story based on the first 220 survey responses

Not only were people more likely to exercise when they saw such labels, they also felt more guilty, Ms Bouton said.

“My findings showed that the exercise labelling was significantly more effective in both chocolate and healthier muesli bars in encouraging consumers to exercise after consumption.

“It increased the likelihood of having higher feelings of guilt after consumption and was more likely to stop [the participant] consuming the chocolate bar with the exercise labelling.”

The 2012 story still didn’t raise the issue of what people said versus actual behaviour, but it did get an independent opinion, who pointed out that calories aren’t the only purpose of food labelling.

More importantly, the stories and the two press releases are all the information I could find online about the research. There don’t seem to be any more details either published or in an online report. It’s good to have stories about scientific research, and this sort of experiment is an important step in thinking about food labelling, but the stories are presenting stronger conclusions that can really be supported by a single unpublished online survey.

December 31, 2013

Meet Manasi Parulekar, Statistics Summer Scholar

Every year, the Department of Statistics offers summer scholarships to a number of students so they can work with our staff on real-world projects. We’ll be profiling them on Stats Chat. 

Manasi is working with Dr Yannan Jiang on a project titled Bariatric surgery and diabetic retinopathy progression. She explains:

“Bariatric surgery is an effective method to achieve rapid weight reduction along with a sustained remission of type 2 diabetesManasi (T2D). However, the effect of the surgery on the progression of diabetes retinopathy (DR) – retinal damage that can lead to loss of vision in both the short and long term – is not documented.

“It is hypothesised that bariatric surgery could be associated with a worsening of DR. In this project, I will be working together with Debbie Chen, a medical student from the Faculty of Medical and Health Sciences, under the joint supervision of Dr Rinki Murphy and Dr Yannan Jiang, to assess the impact of bariatric surgery on DR among patients with T2D.

“This research is very useful, as the results will be used to create the first retinal screening protocols for those having undergone bariatric surgery. So we’ll be creating guidelines to channel limited resources and identify those most at risk.

“I have completed a Bachelor of Science majoring in Psychology and Pharmacology and a Graduate Diploma in Statistics. In 2014 I will be doing my Honours in Statistics.

“Statistics excites me as it is an incredibly diverse field that is applicable to almost everything we do. It is fun to be able to break down large datasets to find patterns and solve problems to get a better understanding of the world around us. The Department of Statistics at the University of Auckland has made the experience especially enjoyable as the lecturers are friendly and approachable and the administration staff are very helpful, creating a great environment in which to learn.

“Over the summer, I will be relaxing by drawing, catching up with family and friends – and I am spending two weeks in India around New Year.”