Posts filed under Research (206)

May 14, 2014

One of the things social media is good for

[Update: 538 now has an intro to the story explaining the mistakes and apologising. Good for them.]

So, at  fivethirtyeight.com there’s this story on mapping kidnappings in Nigeria using data from GDELT, the sort of thing data journalism is supposed to be good at. GDELT automatically extracts information from news stories to build a huge global database.

On Twitter, Erin Simpson, whose about.me page says she is “a leading specialist in the intersection of intelligence, data analysis, irregular warfare, and illicit systems – with an emphasis on novel research designs,” — and who has worked on the GDELT parser — is Not Happy.

Thanks to Storify, here are three summaries of what she says, but a lot of it can be boiled down to one point:

In conclusion: VALIDATE YOUR FREAKING DATA. It’s not true just because it’s on a goddamn map.

(via @LewSOS)
May 8, 2014

Think I’ll go eat worms

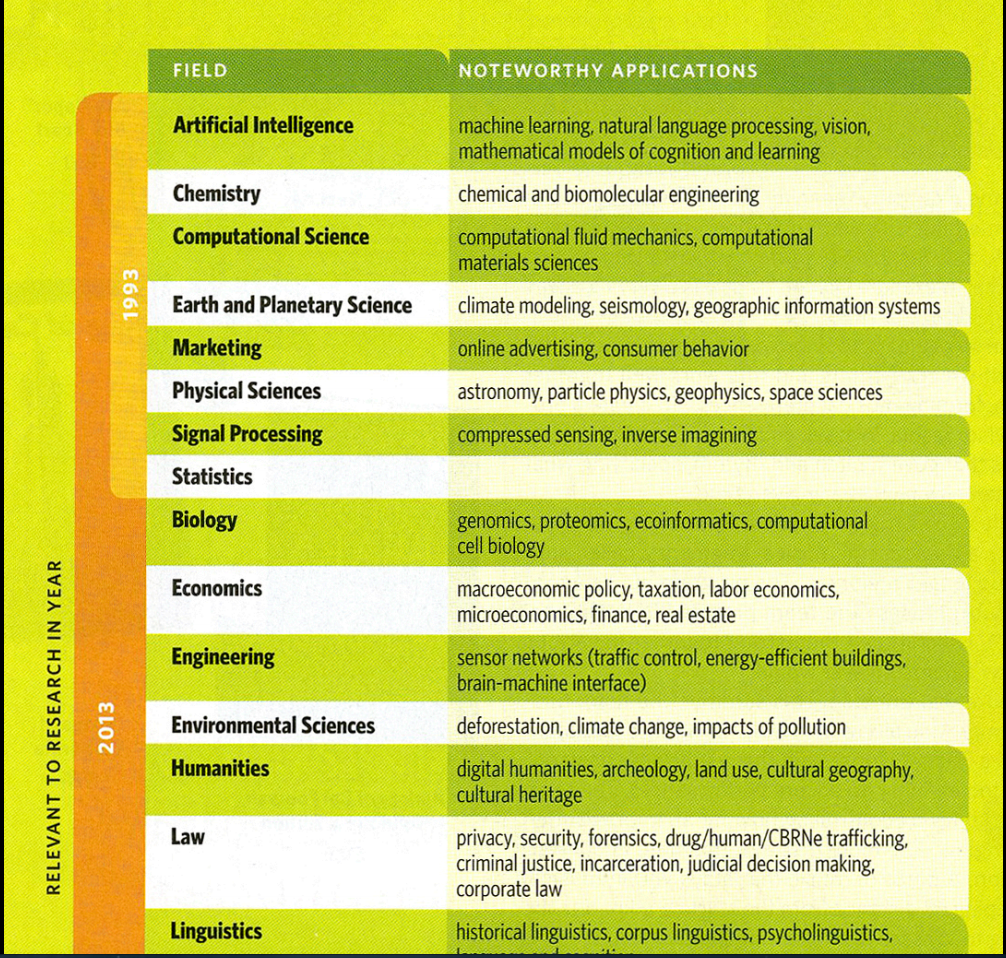
This table is from a University of California alumni magazine

Screen-Shot-2014-05-06-at-9.06.38-PM


Jeff Leek argues at Simply Statistics that the big problem with Big Data is they, too, forgot statistics.

Who’s afraid of the NSA?

Two tweets in my time line this morning linked to this report about this research paper, saying “americans have stopped searching on forbidden words

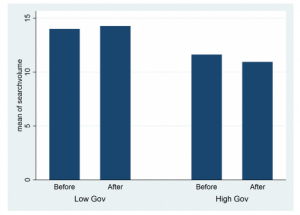
That’s a wild exaggeration, but what the research found was interesting. They looked at Google Trends search data for words and phrases that might be privacy-related in various ways: for example, searches that might be of interest to the US government security apparat or searchers that might be embarrassing if a friend knew about them.

In the US (but not in other countries) there was a small but definite change in searches at around the time of Edward Snowden’s NSA revelations. Search volume in general kept increasing, but searches on words that might be of interest to the government decreased slightly

unnamed

The data suggest that some people in the US became concerned that the NSA might care about them, and given that there presumably aren’t enough terrorists in the US to explain the difference, that knowing about the NSA surveillance is having an effect on political behaviour of (a subset of) ordinary Americans.

There is a complication, though. A similar fall was seen in the other categories of privacy-sensitive data, so either the real answer is something different, or people are worried about the NSA seeing their searches for porn.

May 6, 2014

Animal testing in New Zealand

Wiki New Zealand, which has information on all sorts of things, has a graph showing animal use for research/testing/teaching in NZ over time.  The data are from the annual report (PDF) of the National Animal Ethics Advisory Committee.

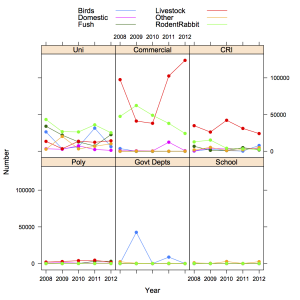
Here’s a slightly more detailed graph showing types of animals and who used them, over time.

animals


It’s also important to remember that nearly all the livestock and domestic animals weren’t harmed significantly — research on things like different feed or stocking densities still counts.  Most of the rodents and rabbits ended up dead, as did about a third of the fish.

The two big increases recently are commercial livestock (most of which are no worse off than they would be anyway as livestock) and fish at universities. The increase in fish is probably due at least in part to substitution of zebrafish for mice in some biological research.

No, I don’t know what the government departments did with 40000 birds in 2009. [Update: thanks to James Green in comments, I now do. I]


[Update: here’s the data in accessible form]

May 5, 2014

Verging on a borderline trend

From Matthew Hankins, via a Cochrane Collaboration blog post, the first few items on an alphabetical list of ways to describe failure to meet a statistical significance threshold

a barely detectable statistically significant difference (p=0.073)
a borderline significant trend (p=0.09)
a certain trend toward significance (p=0.08)
a clear tendency to significance (p=0.052)
a clear trend (p<0.09)
a clear, strong trend (p=0.09)
a considerable trend toward significance (p=0.069)
a decreasing trend (p=0.09)
a definite trend (p=0.08)
a distinct trend toward significance (p=0.07)
a favorable trend (p=0.09)
a favourable statistical trend (p=0.09)
a little significant (p<0.1)
a margin at the edge of significance (p=0.0608)
a marginal trend (p=0.09)
a marginal trend toward significance (p=0.052)
a marked trend (p=0.07)
a mild trend (p<0.09)

Often there’s no need to have a threshold and people would be better off giving an interval estimate including the statistical uncertainty.

The defining characteristic of the (relatively rare) situations where a threshold is needed is that you either pass the threshold or you don’t. A marked trend towards a suggestion of positive evidence is not meeting the threshold.

April 4, 2014

Thomas Lumley’s latest Listener column

…”One of the problems in developing drugs is detecting serious side effects. People who need medication tend to be unwell, so it’s hard to find a reliable comparison. That’s why the roughly threefold increase in heart-attack risk among Vioxx users took so long to be detected …”

Read his column, Faulty Powers, here.

March 26, 2014

Are web-based student drinking interventions worthwhile?

Heavy drinking and the societal harm it causes is a big issue and attracts a lot of media and scholarly attention (and Statschat’s, too). So we were interested to see today’s new release from the Journal of the American Medical Association. It describes a double-blind, parallel-group, individually-randomised trial that studied moderate to heavy student drinkers from seven of our eight universities to see if a web-based alcohol screening and intervention programme reduced their unhealthy drinking behaviour.

And the short answer? Not really. But if they identified as Māori, the answer was … yes, with a caveat. More on that in a moment.

Statistician Nicholas Horton and colleagues used an online questionnaire to identify students at Otago, Auckland, Canterbury, Victoria, Lincoln, Massey, and Waikato who had unhealthy drinking habits. Half the students were assigned at random to receive personalised feedback and the other students had no input. Five months later, researchers followed up with the students on certain aspects of their drinking.

The overall result? “The intervention group tended to have less drinking and fewer problems then the control group, but the effects were relatively modest,” says Professor Horton. The take-away message: A web-based alcohol screening and intervention program had little effect on unhealthy drinking among New Zealand uni students. Restrictions on alcohol availability and promotion are still needed if we really want to tackle alcohol abuse.

But among Māori students, who comprise 10% of our national uni population, those receiving intervention were found to drink 22% less alcohol and to experience 19% fewer alcohol-related academic problems at the five-month follow-up. The paper suggests that Māori students are possibly more heavily influenced by social-norm feedback than non-Māori students. “Māori students may have a stronger group identity, enhanced by being a small minority in the university setting.” But the paper warns that the difference could also be due to chance, “underscoring the need to undertake replication and further studies evaluating web-based alcohol screening and brief intervention in full-scale effectiveness trials.”

The paper is here. Read the JAMA editorial here.


March 25, 2014

An ounce of diagnosis

The Disease Prevention Illusion: a tragedy in five parts, by Hilda Bastian

“An ounce of prevention is worth a pound of cure.” We’ve recognized the false expectations we inflate with the fast and loose use of the word “cure” and usually speak of “treatment” instead. We need to be just as careful with the P-word.


March 18, 2014

Seven sigma?

The cosmologists are excited today, and there is data visualisation all over my Twitter feed

That’s a nice display of uncertainty at different levels of evidence, before (red) and after (blue) adding new data.  To get some idea of what is greater than zero and why they care, read the post by our upstairs neighbour Richard Easther (head of the Physics department)

March 16, 2014

The only way he knows how

Q: Did you see the story about aphrodisiacs on Stuff this weekend?

A: Yes

Q: How did they find out which ones worked?

A: It says “Richard Cornish investigates the only way he knows how.”

Q: Randomised n-of-1 trials with independent evaluation by someone who doesn’t know what he’s eaten?

A: Sadly, no.

Q: Allocating different foods, and some control foods, to a large group of people and collecting their reports?

A: No

Q: Getting a librarian to help him review the scientific research on the topic? Or the traditional knowledge?

A: Not really, though there are some biochemical or historical anecdotes for many of the items.

Q: Um. Did he just try each food as you would if you wanted to use it as an aphrodisiac?

A: Not that, either.

Q: I give up. What did he do?

A: ” It was my task to consume them in a bland environment, with no chance of any stimulation or excitement.”

Q: What a waste. But aren’t you being a bit harsh?  He’s a food writer and TV producer. He does sustainability and Spanish food. He’s not a science journalist or an investigative reporter.  They didn’t expect anyone to take it seriously.

A: Ok, but some of the nutrition stories and sex stories they run are supposed to be taken seriously. It should be easier to tell which is which online.

Q: Wait, isn’t it March now?

A: Yes.

Q: That sounds more like a Valentine’s Day column

A: An interesting point. You thought of that faster than I did.

Q: Well?

A: It is a Valentine’s Day column. From the Southland Times. Except they took out the foie gras and truffles to make it suitable for the national audience. Reruns aren’t just for The Simpsons, you know.