Posts filed under Random variation (139)

October 9, 2013

Bell curves, bunnies, and dragons

Keith Ng points me to something that’s a bit more technical than we usually cover here on StatsChat, but it was in the New York Times, and it does have  redeeming levels of cutesiness: an animation of the central limit theorem using bunnies and dragons

The point made by the video is that the Normal distribution, or ‘bell curve’, is a good approximation to the distribution of averages even when it is a very poor approximation to the distribution of individual measurements.  Averaging knocks all the corners off a distribution, until what is left can be described just by its mean and spread.  (more…)

Prediction is hard

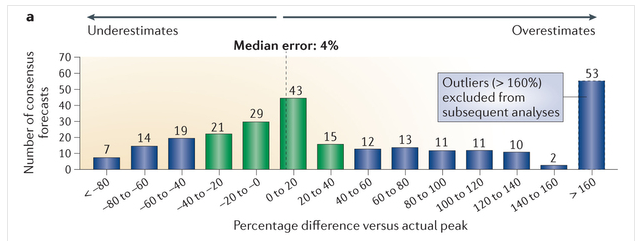
How good are sales predictions for newly approved drugs?

Not very (via Derek Lowe at  In the Pipeline)

Forecasts

There’s a wide spread around the true value. There’s less than a 50:50 chance of being within 40%, and a substantial chance of being insanely overoptimistic. Derek Lowe continues

Now, those numbers are all derived from forecasts in the year before the drugs launched. But surely things get better once the products got out into the market? Well, there was a trend for lower errors, certainly, but the forecasts were still (for example) off by 40% five years after the launch. The authors also say that forecasts for later drugs in a particular class were no more accurate than the ones for the first-in-class compounds. All of this really, really makes a person want to ask if all that time and effort that goes into this process is doing anyone any good at all.


September 25, 2013

Briefly

  • Big Data and Due Process: fairly readable academic paper arguing for legal protections against harm done by automated classification (accurate or inaccurate)
  • The Herald quotes Maurice Williamson on a drug seizure operation

“The harm prevented from keeping these analogues away from communities has been calculated at $32 million,” Mr Williamson said.

Back in 2008, Russell Brown explained where these numbers come from. As you might expect, there is no reasonable sense in which they are estimates of harm prevented. They don’t measure what communities should care about.

  • Levels of statistical evidence are ending up in the US Supreme court. At issue is whether  a press release claiming that a treatment”Reduces Mortality by 70% in Patients with Mild to Moderate Disease” is fraud when the study wasn’t set up to look at mortality and when the reduction wasn’t statistically significant by usual standards.  Since a subsequent trial designed to look at mortality reductions convincingly failed to find them, the conclusion implied by the press release title is untrue, but the legal argument is whether, at the time, it was fraud.
  • From New Scientist: is ‘personalised’ medicine actually bad for public health?


—ing margins of error

A bit of background, for non-computer people.  Sensible programmers keep their programs in version-control systems. Among other things, these store explanatory messages for each change to the code.  In a perfect world, these messages would be concise and informative descriptions of the change. Our world is sadly imperfect.

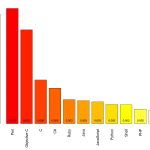
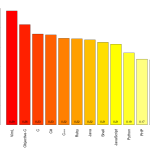
Ramiro Gomez has worked through the archives of change messages on the largest public version-control site, github, to look for “expressions of emotional content”, such as surprise and swearing, and divided these up by the programming language being used. Programmers will not be surprised to learn that Perl has the highest rate of surprise and that the C-like languages have high rates of profanity. If you want to find which words he looked for, you’ll have to read his post.
git-bar-surprisegit-bar-swearing


He notes

Even though a minimum of 40,000 samples per languages seemed adequate to me (I wanted to include Perl), different sample sizes result in varying accuracy, which is a problem and a bit like comparing apples and oranges. Statisticians will probably deny any value of such an approach, still I think it can serve to develop some hypotheses.

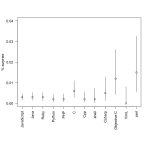
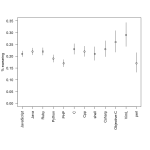
Statisticians have no problem with varying sample sizes, but we would like uncertainty estimates.  That’s especially true for the ‘surprise’ category, where the number of messages is very small.

So, as a service to programmers of an inquiring disposition, here are the proportions with confidence intervals. They are slightly approximate, since I had to read the sample sizes off the graph.
git-surprisegit-swearing


(via @TheAtavism and @teh_aimee)

September 15, 2013

Sometimes you don’t need to do the maths

On Friday, Stuff had a story about 10 pairs of twins in the same school in Wellington.

At this point I was going to break out the Stats New Zealand website and find out how many pairs of twins of school age there are in the country, and work how many schools you’d expect to have these sorts of numbers.  But when I went back to search for the story I found

  • A Herald story from last September, with 14 sets of twins in a Dunedin school
  • A Stuff story from last October, with 4 sets, in Timaru
  • A Stuff story from April, with 9 sets, in Manurewa
  • A Stuff story from June, with 3 sets in the same class, Palmerston Nth
  • A Stuff story from August, with 5 sets of twins and two of triplets, in Timaru

That’s just the past year, since the stories go on back in the past, and even stretch to other countries: a Stuff story from June was about 24 sets of twins in an Illinois school.

At some point it must be hard to keep pretending this is a surprise.


Briefly

crop-nautilus-rx

To be fair, the purpose of the chart probably is just to look ugly and complicated, not to convey quantitative information

  • A fascinating statistic: 1/3 of emergency calls (111 number) are due to pocket dialing from mobile phones. Since nearly 50% are real, that means Kiwi butts are responsible for twice as many calls as pranks and cranks.
August 19, 2013

Sympathetic magic again

Once again, the Herald is relying on sympathetic magic in a nutrition story (previous examples)

1. Walnuts: These nuts look just like a brain, so it makes sense that they’re packed with good stuff for your grey matter.The British Journal of Nutrition reported that eating half a cup of walnuts a day for eight weeks increased reasoning skills by nearly 12 per cent in students. 

There’s no way that the appearance of a natural food could possibly be a guide to its nutritional value — how would the walnut know that it’s good for human brains, and why would it care? Pecans, which look a bit like brains, don’t contain the levels of n-3 fatty acids that are supposed to be the beneficial component of walnuts, and fish and flax seeds, which do contain n-3 fatty acids, don’t look like brains.

The story gets two cheers for almost providing a reference: searching on “British Journal of Nutrition walnuts reasoning skills” leads to the paper. It’s a reasonable placebo-controlled randomised experiment, with participants eating banana bread with or without walnuts.  The main problem is that the researchers tested 34 measurements of cognitive function or mood, and found a difference in just one of them.  As they admit

The authors are unable to explain why inference alone was affected by consumption of walnuts and not the other ‘critical thinking’ subtests – recognition of assumption, deduction, interpretation, and evaluation of arguments.

The prior research summarised in the paper shows the same problem, eg,  one dose of walnuts improved one coordination test in rats, but a higher dose improved a different test, and the highest dose didn’t improve anything.

August 17, 2013

False positives

From a number of fields

So when one particular paper began to strain the servers, attracting hundreds if not thousands of downloads, the entire editorial board began to pay attention. “What,” they asked, “is so special about this paper on the ryanodine receptor of Caenorhabditis elegans?” (For those of you who don’t know, Caenorhabditis elegans is a very common and much-loved model animal—it’s a small, soil-living roundworm with some very useful features. Please don’t ask me what a ryanodine receptor is; I don’t know and I don’t really care.)

  • Along similar lines, someone reminded me of the problem the UK town of Scunthorpe has with text filtering.  There is an old joke that there are two other football teams whose names contain swear words (punchline)
August 12, 2013

Shocked (shocked!) by rate increases.

Nathaniel Wilson nominates a Stat of the Week that I’d noticed this morning but hadn’t had time to write up.

The Herald story begins

Aucklanders’ rates bills have arrived in letterboxes and the figures have come as a shock to some homeowers who have seen rises of 10 per cent – despite the council promising an average increase of 2.9 per cent.

Obviously there’s nothing inconsistent about the average being 2.9% and the maximum being 10%.  NZ’s average income is about $48000, but I take home somewhat more than that, and the CEO of Fonterra makes a whole lot more, and he may well not be the maximum. The average and the maximum are different. That’s not a shock.

The other point, that our nominator doesn’t make, is that rate increases are capped at 10%, and that all the people who hit the cap last year already knew that they would be seeing an increase this year, and roughly how much it would be. I know this because I live in Onehunga, where property values have gone up quite a lot, and I’m one of the people with a large rate increase. Since I read the rates notice I received last year I’m not at all shocked. I don’t have to say whether I’m happy or not, but it certainly wasn’t a surprise.


July 30, 2013

Always ask for the margin of error

The Herald now has picked up this morning’s UK story from the London Fire Brigade, that calls from people handcuffed or otherwise stuck in embarassing circumstances are on the rise.  The Fire Brigade only said

“I don’t know whether it’s the Fifty Shades effect, but the number of incidents involving items like handcuffs seems to have gone up.

The Herald has the relatively sedate headline “‘Fifty Shades of Grey effect’ plagues London“, but the British papers go further (as usual).   For example, the Mirror’s headline was “Fifty Shades of Grey sex leads to soaring 999 calls“.  This is the sort of story that’s too good to check, so no-one seems to have asked how much evidence there is of an increase.

The actual numbers quoted by the fire brigade for calls to people stuck in what could loosely be called household items were: 416 in 2010/11, 441 in 2011/12, and 453in 2012/13. If you get out your Poisson distribution and do some computations, it turns out this is well within the expected random variation — for example the p-value for a test of trend is 0.22 (or for the Bayesians, the likelihood ratio is also very unimpressive). Much more shades of grey than black and white.

So, if you don’t have hot and cold running statisticians at your newspaper, how can you check this sort of thing?  There’s a simple trick for the margin of error for a count of things on a hand calculator: take the square root, add and subtract 1 to get upper and lower  limits, then square them again.  Conveniently, in this case, 441 is exactly 21 squared, so an uncertainty interval around the 441 value would go from 20 squared (400) to 22 squared (484).