Posts filed under Random variation (139)

February 13, 2014

How stats fool juries

Prof Peter Donnelly’s TED talk. You might want to skip over the first few minutes of vaguely joke-like objects

Consider the two (coin-tossing) patterns HTH and HTT. Which of the following is true:

  1. The average number of tosses until HTH is larger than the average number of tosses until HTT
  2. The average number of tosses until HTH is the same as  the average number of tosses until HTT
  3. The average number of tosses until HTH is smaller than the average number of tosses until HTT?

Before you answer, you should know that most people, even mathematicians, get this wrong.

Also, as Prof Donnelly doesn’t point out, if you have a programming language handy, you can find out the answer very easily.

February 4, 2014

What an (un)likely bunch of tosse(r)s?

It was with some amazement that I read the following in the NZ Herald:

Since his first test in charge at Cape Town 13 months ago, McCullum has won just five out of 13 test tosses. Add in losing all five ODIs against India and it does not make for particularly pretty reading.

Then again, he’s up against another ordinary tosser in MS Dhoni, who has got it right just 21 times out of 51 tests at the helm. Three of those were in India’s past three tests.

The implication of the author seems to be that five out of 13, or 21 out of 51 are rather unlucky for a set of random coin tosses, and that the possibility exists that they can influence the toss. They are unlucky if one hopes to win the coin toss more than lose it, but there is no reason to think that is a realistic expectation unless the captains know something about the coin that we don’t.

Again, simple application of the binomial distribution shows how ordinary these results are. If we assume that the chance of winning the toss is 50% (Pr(Win) = 0.5) each time, then in 13 throws we would expect to win, on average, 6 to 7 times (6.5 for the pedants). Random variation would mean that about 90% of the time, we would expect to see four to nine wins in 13 throws (on average). So McCullum’s five from 13 hardly seems unlucky, or exceptionally bad. You might be tempted to think that the same may not hold for Dhoni. Just using the observed data, his estimated probability of success is 21/51 or 0.412 (3dp). This is not 0.5, but again, assuming a fair coin, and independence between tosses, it is not that unreasonable either. Using frequentist theory, and a simple normal approximation (with no small sample corrections), we would expect 96.4% of sets of 51 throws to yield somewhere between 18 and 33 successes. So Dhoni’s results are somewhat on the low side, but they are not beyond the realms of reasonably possibility.

Taking a Bayesian stance, as is my wont, yields a similar result. If I assume a uniform prior – which says “any probability of success between 0 and 1 is equally likely”, and binomial sampling, then the posterior distribution for the probability of success follows a Beta distribution with parameters a = 21+ 1 = 22, and b = 51 – 21 + 1 = 31. There are a variety of different ways we might use this result. One is to construct a credible interval for the true value of the probability of success. Using our data, we can say there is about a 95% chance that the true value is between 0.29 and 0.55 – so again, as 0.5 is contained within this interval, it is possible. Alternatively, the posterior probability that the true probability of success is less than 0.5 is about 0.894 (3dp). That is high, but not high enough for me. It says there at about a 1 in 10 chance that the true probability of success could actually be 0.5 or higher.

January 14, 2014

Causation, counterfactuals, and Lotto

A story in the Herald illustrates a subtle technical and philosophical point about causation. One of Saturday’s Lotto winners says

“I realised I was starving, so stopped to grab a bacon and egg sandwich.

“When I saw they had a Lotto kiosk, I decided to buy our Lotto tickets while I was there.

“We usually buy our tickets at the supermarket, so I’m glad I followed my gut on this one,” said one of the couple, who wish to remain anonymous.

Assuming it was a random pick, it’s almost certainly true that if they had not bought the ticket at that Lotto kiosk at that time, they would not have won.  On the other hand, if Lotto is honest, buying at that kiosk wasn’t a good strategy — it had no impact on the chance of winning.

There is a sense in which buying the bacon-and-egg sandwich was a cause of the win, but it’s not a very useful sense of the word ’cause’ for most statistical purposes.

The dangers of better measurement

An NPR News story on back pain and its treatment

One reason invasive treatments for back pain have been rising in recent years, Deyo says, is the ready availability of MRI scans. These detailed, color-coded pictures that can show a cross-section of the spine are a technological tour de force. But they can be dangerously misleading.

This MRI shows a mildly herniated disc. That's the sort of thing that looks abnormal on a scan but may not be causing pain and isn't helped by surgery.

This MRI shows a mildly herniated disc. That’s the sort of thing that looks abnormal on a scan but may not be causing pain and isn’t helped by surgery.

“Seeing is believing,” Deyo says. “And gosh! We can actually see degenerated discs, we can see bulging discs. We can see all kinds of things that are alarming.”

That is, they look alarming. But they’re most likely not the cause of the pain.

January 6, 2014

In the deep midwinter

It’s cold in the United States at the moment. Very cold. Temperatures in places where lots of people live are down below -20C (before worrying about the wind chill).This isn’t just hypothermia weather, this is ‘exposed skin freezes in minutes’ weather, and hasn’t been seen on such a large scale for decades. So why isn’t this evidence against global warming?

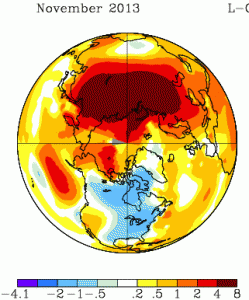
It will be a month or two before we have the global data, but the severe cold snaps in recent years have been due to cold air being in unusual places, rather than to the world being colder that week. For example, November 2013 was also cold in the North America, but it was warm in northern Russia; the cold had just moved (map from NASA).

nmaps


The cold spells in Europe in recent years have been matched by warm spells in Greenland and northeast Canada. You don’t hear about these as much, because hardly anyone lives there.  The ‘polar vortex‘ being described on the US news is an example of the same thing: cold air that usually stays near the pole has moved down to places where people live. That suggests the global temperature anomaly maps for December/January will show warmer-than-usual conditions in other parts of the far northern hemisphere.

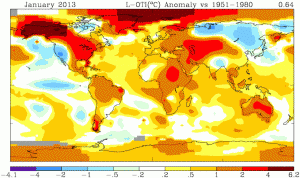
For contrast, look at the heat wave in Australia last January, when the Bureau of Meteorology had to find a new colour to depict really, really, really hot. This map is from the same NASA source (just a different projection)

nmaps-oz


Not only was all of Australia hot, the ocean south of Australia was warmer than typical. This wasn’t a case of cold air from the Southern Ocean failing to reach Australia, which causes heat waves in Melbourne several times a year. It doesn’t look like a case of just moving heat around.

No single weather event can provide any meaningful evidence for or against global warming. What’s important for honest scientific lobbying is whether this sort of event is likely to become more common as a result. The Australian heat waves definitely are. The situation is less clear for the US winter cold: the baseline temperatures will go up, which will mitigate future cold snaps, but there is some initial theoretical support for the idea that warming of the Arctic Ocean increases the likelihood that polar vortices will wander off into inhabited areas.


[note: you can also see in the Jan 2013 picture that the warm winter in the US was partly balanced by cold in Siberia that you didn’t hear so much about]

January 2, 2014

Toll, poll, and tolerance.

The Herald has a story that  has something for everyone.  On the front page of the website it’s labelled “Support for lower speed limit“, but when you click through it’s actually about the tighter tolerance (4km/h, rather than 10km/h) for infringement notices being used on the existing speed limits.

The story is about a real poll, which found about 2/3 support for the summer trial of tighter speed limits. Unfortunately, the poll seems to have had really badly designed questions. Either that, or the reporting is jumping to unsupportable conclusions:

The poll showed that two-thirds of respondents felt that the policy was fair because it was about safety. Just 29 per cent said that it was unfair and was about raising revenue.

That is, apparently the alternatives given for respondents combined both whether they approved of the policy and what they thought the reason was.  That’s a bad idea for two reasons. Firstly, it confuses the respondents, when it’s hard enough getting good information to begin with. Secondly, it pushes them towards an answer.   The story is decorated with a bogus clicky poll, which has a better set of questions, but, of course, largely meaningless results.

The story also quotes the Police Minister attributing a 25% lower death toll during  the Queen’s Birthday weekends to the tighter tolerance

“That means there is an average of 30 people alive today who can celebrate Christmas who might not otherwise have been,” Mrs Tolley said.

We’ve looked at this claim before. It doesn’t hold up. Firstly, there has been a consistently lower road toll, not just at holiday weekends.  And secondly, the Ministry of Transport says that driving too fast for the conditions is a only even one of the contributing factors in 29% of fatal crashes, so getting a 25% reduction in deaths just from tightening the tolerance seems beyond belief.  To be fair, the Minister only said the policy “contributed” to the reduction, so even one death prevented would technically count, but that’s not the impression being given.

What’s a bit depressing is that none of the media discussion I’ve seen of the summer campaign has asked what tolerance is actually needed, based on accuracy of speedometers and police speed measurements. And while stories mention that the summer campaign is a trial run to be continued if it is successful, no-one seems to have asked what the evaluation criteria will be and whether they make sense.

(suggested by Nick Iversen)

December 15, 2013

How much evidence would you expect to see?

[UPDATE: I got the calculations wrong, and was too kind to the MoT and the paper. The time to get good evidence is more like 20 years.]


The Sunday Star-Times has a story saying that the reduction in speed-limit tolerance, which is now on all the time in the summer, hasn’t yet shown evidence of a reduction in road deaths. And they’re right, it hasn’t, despite some special pleading from the Police Minister and Assistant Commissioner David Cliff. We’ve looked at this issue before.

However, it’s also important to ask whether we’d expect to see evidence yet if the policy really worked as promised. The Star-Times goes on to say:

While MOT data shows just 13 per cent of fatal crashes were attributable to speed Land Transport Safety Authority spokesman Andy Knackstedt said there was “a wealth of evidence” that showed even very small reductions in speed led to reductions in fatalities and serious injuries, and that lowering the enforcement tolerance meant lower mean speeds.

So, we should ask whether we’d expect a clear and convincing drop in road deaths if the theory behind the policy was sound. And we wouldn’t.

Let’s see what we should expect if the policy prevented 10% or 20% of the deaths from speeding, which works out to 1.3% or 2.6% of all road deaths.  The number of deaths last year was 286, over 366 days. Under the simplest model for road crash data, a Poisson process that basically assumes different roads and time periods are independent, we can work out how long you’d have to wait to have a 50% chance or an 80% chance of the reduction getting below the margin of error

For a 20% reduction in deaths from speeding it takes about 190 days to have an even-money chance of seeing evidence, and about 390 days to have an 80% chance. For a 10% reduction in deaths from speeding it takes about 380 days for an even-money chance of convincing evidence and 760 days for an 80% chance. Under more complex and realistic models for road deaths it would take longer.

There’s no way that we could expect to see convincing evidence yet, and given the much larger unexplained fall in road deaths in recent years, it will probably never be feasible to evaluate the policy just based on road death counts.  We’re going to have to rely on other evidence: overseas data, information on reductions in speeding, data from non-fatal or even non-injury crashes, and other messier sources.

November 29, 2013

Roundup retraction

I’ve written before about the Seralini research that involved feeding glyphosate and GM corn to rats. Now, Retraction Watch is reporting that the paper will be retracted.

This is a slightly unusual retraction: typically either the scientist has a horrible realisation that something went wrong (maybe their filters were affecting composition of their media) or the journal has a horrible realisation that something went wrong (maybe the images were Photoshopped or the patients didn’t actually exist).

The Seralini paper, though, is being retracted for being kinda pointless. The editors emphasise that they are not suggesting fraud, and write

A more in-depth look at the raw data revealed that no definitive conclusions can be reached with this small sample size regarding the role of either NK603 or glyphosate in regards to overall mortality or tumor incidence. Given the known high incidence of tumors in the Sprague-Dawley rat, normal variability cannot be excluded as the cause of the higher mortality and incidence observed in the treated groups.

Ultimately, the results presented (while not incorrect) are inconclusive, and therefore do not reach the threshold of publication for Food and Chemical Toxicology. 

They’re certainly right about that, but this is hardly a new finding. I’m not really happy about retraction of papers when it isn’t based on new information that wasn’t easily available at the time of review. Too many pointless and likely wrong papers are published, but this one is being retracted for being pointless, likely wrong, and controversial.


[Update: mass enthusiasm for the retraction is summarised by Peter Griffin]

November 27, 2013

Interpretive tips for understanding science

From David Spiegelhalter, William Sutherland, and Mark Burgman, twenty (mostly statistical) tips for interpreting scientific findings

To this end, we suggest 20 concepts that should be part of the education of civil servants, politicians, policy advisers and journalists — and anyone else who may have to interact with science or scientists. Politicians with a healthy scepticism of scientific advocates might simply prefer to arm themselves with this critical set of knowledge.

A few of the tips, without their detailed explication:

  • Differences and chance cause variation
  • No measurement is exact
  • Bigger is usually better for sample size
  • Controls are important
  • Beware the base-rate fallacy
  • Feelings influence risk perception
November 19, 2013

Briefly

  • Animated visualisation of motor vehicle accident rates over the year in Australia. Unfortunately it’s based on just one year of data, which isn’t really enough. And if you’re going the effort of the animation, it would have been nice to use it to illustrate uncertainty/variability in the data
  • Randomised trials outside medicine: the combined results of ten trials of restorative justice conferences. Reoffending over the next two years was reduced, and the victims were happier with the handling of the case. (via @hildabast)
  • How much do @nytimes tweets affect pageviews for their stories?