An XKCD classic
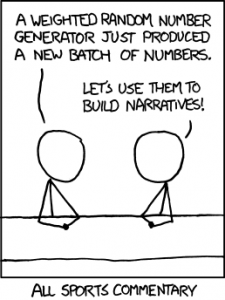
The mouseover text says “Also, all financial analysis. And, more directly, D&D.”
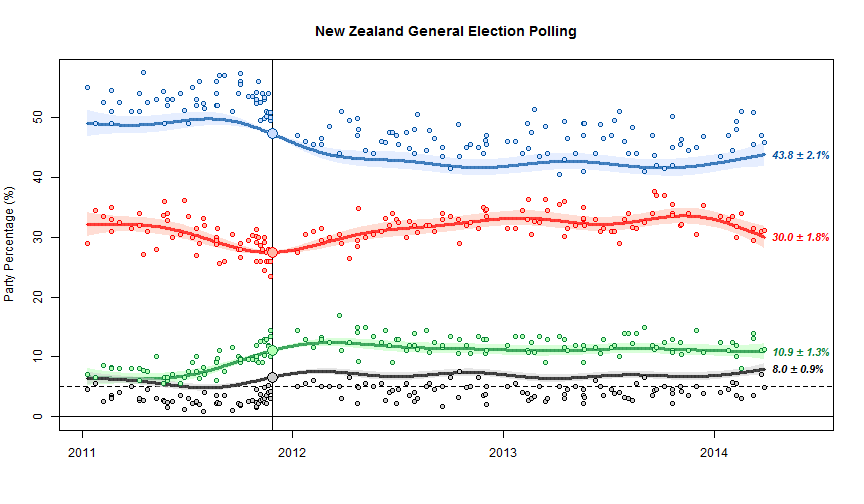
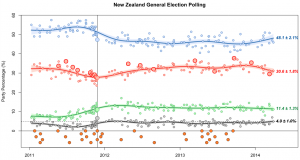
We’re getting to the point in the electoral cycle where opinion polls qualify as well. There will be lots of polls, and lots media and blog writing that tries to tell stories about the fluctuations from poll to poll that fit in with their biases or their need to sell advertising. So, as an aid to keeping calm and believing nothing, I thought a reminder about variability would be useful.
The standard NZ opinion poll has 750-1000 people. The ‘maximum margin of error’ is about 3.5% for 730 and about 3% for 1000. If the poll is of a different size, they will usually quote the maximum margin of error. If you have 20 polls, 19 of them should get the overall left:right division to within the maximum margin of error.
If you took 3.5% from the right-wing coalition and moved it to the left-wing coalition, or vice versa, you’d change the gap between them by 7% and get very different election results, so getting this level of precision 19 times out of 20 isn’t actually all that impressive unless you consider how much worse it could be. And in fact, polls likely do a bit worse than this: partly because voting preferences really do change, partly because people lie, and partly because random sampling is harder than it looks.
Often, news headlines are about changes in a poll, not about a single poll. The uncertainty in a change is higher than in a single value, because one poll might have been too low and the next one too high. To be precise, the uncertainty is 1.4 times higher for a change. For a difference between two 750-person polls, the maximum margin of error is about 5%.
You might want a less-conservative margin than 19 out of 20. The `probable error’ is the error you’d expect half the time. For a 750-person poll the probable error is 1.3% for a single party and single poll, 2.6% for the difference between left and right in a single poll, and 1.9% for a difference between two polls for the same major party.
These are all for major parties. At the 5% MMP threshold the margin of error is smaller: you can be pretty sure a party polling below 3.5% isn’t getting to the threshold and one polling about 6.5% is, but that’s about it.
If a party gets an electorate seat and you want to figure out if they are getting a second List seat, a national poll is not all that helpful. The data are too sparse, and the random sampling is less reliable because minor parties tend to have more concentrated support. At 2% support the margin of error for a single poll is about 1% each way.
Single polls are not very useful, but multiple polls are much better, as the last US election showed. All the major pundits who used sensible averages of polls were more accurate than essentially everyone else. That’s not to say experts opinion is useless, just that if you have to pick just one of statistical voodoo and gut instinct, statistics seems to work better.
In NZ there are several options. Peter Green does averages that get posted at Dim Post; his code is available. KiwiPollGuy does averages and also writes about the iPredict betting markets, and pundit.co.nz has a Poll of Polls. These won’t work quite as well as in the US, because the US has an insanely large number of polls and elections to calibrate them, but any sort of average is a big improvement over looking one poll at a time.
A final point: national polls tell you approximately nothing about single-electorate results. There’s just no point even looking at national polling results for ACT or United Future if you care about Epsom or Ohariu.
