Posts filed under Random variation (139)

February 27, 2015

Quake prediction: how good does it need to be?

From a detailed story in the ChCh Press, (via Eric Crampton) about various earthquake-prediction approaches

About 40 minutes before the quake began, the TEC in the ionosphere rose by about 8 per cent above expected levels. Somewhat perplexed, he looked back at the trend for other recent giant quakes, including the February 2010 magnitude 8.8 event in Chile and the December 2004 magnitude 9.1 quake in Sumatra. He found the same increase about the same time before the quakes occurred.

Heki says there has been considerable academic debate both supporting and opposing his research.

To have 40 minutes warning of a massive quake would be very useful indeed and could help save many lives. “So, why 40 minutes?” he says. “I just don’t know.”

He says if the link were to be proved more firmly in the future it could be a useful warning tool. However, there are drawbacks in that the correlation only appears to exist for the largest earthquakes, whereas big quakes of less than magnitude 8.0 are far more frequent and still cause death and devastation. Geomagnetic storms can also render the system impotent, with fluctuations in the total electron count masking any pre-quake signal.

Let’s suppose that with more research everything works out, and there is a rise in this TEC before all very large quakes. How much would this help in New Zealand? The obvious place is Wellington. A quake over 8.0 magnitude has been observed in the area in 1855, when it triggered a tsunami. A repeat would also shatter many of the earthquake-prone buildings. A 40-minute warning could save many lives. It appears that TEC shouldn’t be that expensive to measure: it’s based on observing the time delays in GPS satellite transmissions as they pass through the ionosphere, so it mostly needs a very accurate clock (in fact, NASA publishes TEC maps every five minutes). Also, it looks like it would be very hard to hack the ionosphere to force the alarm to go off. The real problem is accuracy.

The system will have false positives and false negatives. False negatives (missing a quake) aren’t too bad, since that’s where you are without the system. False positives are more of a problem. They come in two forms: when the alarm goes off completely in the absence of a quake, and when there is a quake but no tsunami or catastrophic damage.

Complete false predictions would need to be very rare. If you tell everyone to run for the hills and it turns out to be sunspots or the wrong kind of snow, they will not be happy: the cost in lost work (and theft?) would be substantial, and there would probably be injuries.  Partial false predictions, where there was a large quake but it was too far away or in the wrong direction to cause a tsunami, would be just as expensive but probably wouldn’t cause as much ill-feeling or skepticism about future warnings.

Now for the disappointment. The story says “there has been considerable academic debate”. There has. For example, in a (paywalled) paper from 2013 looking at the Japanese quake that prompted Heki’s idea

A detailed analysis of the ionospheric variability in the 3 days before the earthquake is then undertaken, where a simultaneous increase in foF2 and the Es layer peak plasma frequency, foEs, relative to the 30-day median was observed within 1 h before the earthquake. A statistical search for similar simultaneous foF2 and foEs increases in 6 years of data revealed that this feature has been observed on many other occasions without related seismic activity. Therefore, it is concluded that one cannot confidently use this type of ionospheric perturbation to predict an impending earthquake.

In translation: you need to look just right to see this anomaly, and there are often anomalies like this one without quakes. Over four years they saw 24 anomalies, only one shortly before a quake.  Six complete false positives per year is obviously too many.  Suppose future research could refine what the signal looks like and reduce the false positives by a factor of ten: that’s still evacuation alarms with no quake more than once every two years. I’m pretty sure that’s still too many.
 

February 12, 2015

Two types of brain image study

If a brain imaging study finds greater activation in the asymmetric diplodocus region or increased thinning in the posterior homiletic, what does that mean?

There are two main possibilities. Some studies look at groups who are different and try to understand why. Other studies try to use brain imaging as an alternative to measuring actual behaviour. The story in the Herald (from the Washington Post), “Benefit of kids’ music lessons revealed – study” is the second type.

The researchers looked at 334 MRI brain images from 232 young people (so mostly one each, some with two or three), and compared the age differences in young people who did or didn’t play a musical instrument.  A set of changes that happens as you grow up happened faster for those who played a musical instrument.

“What we found was the more a child trained on an instrument,” said James Hudziak, a professor of psychiatry at the University of Vermont and director of the Vermont Center for Children, Youth and Families, “it accelerated cortical organisation in attention skill, anxiety management and emotional control.

An obvious possibility is that kids who play a musical instrument have different environments in other ways, too.  The researchers point this out in the research paper, if not in the story.  There’s a more subtle issue, though. If you want to measure attention skill, anxiety management, or emotional control, why wouldn’t you measure them directly instead of measuring brain changes that are thought to correlate with them?

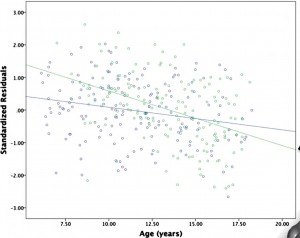
Finally, the effect (if it is an effect) on emotional and behavioural maturation (if it is on emotional and behavioural maturation) is very small. Here’s a graph from the paper
PowerPoint Presentation


The green dots are the people who played a musical instrument; the blue dots are those who didn’t.  There isn’t any dramatic separation or anything — and to the extent that the summary lines show a difference it looks more as if the musicians started off behind and caught up.

January 31, 2015

Big buts for factoid about lying

At StatsChat, we like big buts, and an easy way to find them is unsourced round numbers in news stories. From the Herald (reprinted from the Telegraph, last November)

But it’s surprising to see the stark figure that we lie, on average, 10 times a week.

It seems that this number comes from an online panel survey in the UK last year (Telegraph, Mail) — it wasn’t based on any sort of diary or other record-keeping, people were just asked to come up with a number. Nearly 10% of them said they had never lied in their entire lives; this wasn’t checked with their mothers.  A similar poll in 2009 came up with much higher numbers: 6/day for men, 3/day for women.

Another study, in the US, came up with an estimate of 11 lies per week: people were randomised to trying not to lie for ten weeks, and the 11/week figure was from the control group.  In this case people really were trying to keep track of how often they lied, but they were a quite non-representative group. The randomised comparison will be fair, but the actual frequency of lying won’t be generalisable.

The averages are almost certainly misleading, because there’s a lot of variation between people. So when the Telegraph says

The average Briton tells more than 10 lies a week,

or the Mail says

the average Briton tells more than ten lies every week,

they probably mean the average number of self-reported lies was more than 10/week, with the median being much lower. The typical person lies much less often than the average.

These figures are all based on self-reported remembered lies, and all broadly agree, but another study, also from the US, shows that things are more complicated

Participants were unaware that the session was being videotaped through a hidden camera. At the end of the session, participants were told they had been videotaped and consent was obtained to use the video-recordings for research.

The students were then asked to watch the video of themselves and identify any inaccuracies in what they had said during the conversation. They were encouraged to identify all lies, no matter how big or small.

The study… found that 60 percent of people lied at least once during a 10-minute conversation and told an average of two to three lies.


January 16, 2015

Holiday road toll

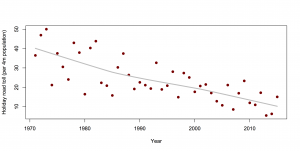
Here are the data, standardised for population but not for the variation in the length of the period, the weather, or anything else

holiday

As you can see, the numbers are going down, and there’s quite a bit of variability — as the police say

“It’s the small things that often contribute to having a significant impact. Small decisions, small errors..”

Fortunately, the random-variation viewpoint is getting a reasonable hearing this year:

  • Michael Wright, in the ChCh PressBut the idea that a high holiday road toll exposed its flaws may be dumber still. A holiday week or weekend is too short a period to mean anything more.”
  • Eric Crampton, in the Herald: “People have a bad habit of wanting to tell stories about random low-probability events.”


December 7, 2014

Bot or Not?

Turing had the Imitation Game, Phillip K. Dick had the Voight-Kampff Test, and spammers gave us the CAPTCHA.  The Truthy project at Indiana University has BotOrNot, which is supposed to distinguish real people on Twitter from automated accounts, ‘bots’, using analysis of their language, their social networks, and their retweeting behaviour. BotOrNot seems to sort of work, but not as well as you might expect.

@NZquake, a very obvious bot that tweets earthquake information from GeoNet, is rated at an 18% chance of being a bot.  Siouxsie Wiles, for whom there is pretty strong evidence of existence as a real person, has a 29% chance of being a bot.  I’ve got a 37% chance, the same as @fly_papers, which is a bot that tweets the titles of research papers about fruit flies, and slightly higher than @statschat, the bot that tweets StatsChat post links,  or @redscarebot, which replies to tweets that include ‘communist’ or ‘socialist’. Other people at a similar probability include Winston Peters, Metiria Turei, and Nicola Gaston (President of the NZ Association of Scientists).

PicPedant, the twitter account of the tireless Paulo Ordoveza, who debunks fake photos and provides origins for uncredited ones, rates at 44% bot probability, but obviously isn’t.  Ben Atkinson, a Canadian economist and StatsChat reader, has a 51% probability, and our only Prime Minister (or his twitterwallah), @johnkeypm, has a 60% probability.


November 28, 2014

Speed, crashes, and tolerances

The police think the speed tolerance change last year worked

Last year’s Safer Summer campaign introduced a speed tolerance of 4km/h above the speed limit for all of December and January, rather than just over the Christmas and New Year period. Police reported a 36 per cent decrease in drivers exceeding the speed limit by 1-10km/h and a 45 per cent decrease for speeding in excess of 10km/h.

Fatal crashes decreased by 22 per cent over the summer campaign. Serious injury crashes decreased by 8 per cent.

According to data from the NZTA Crash Analysis System, ‘driving too fast for the conditions’ was one of the contributing factors in about 20% of serious injury crashes and 30% of fatal crashes over the past seven years. The reductions in crashes seem more than you’d expect from those reductions in speeding.

So, I decided to look at the reduction in crashes where speed was a contributing factor, according to the Crash Analysis System data.

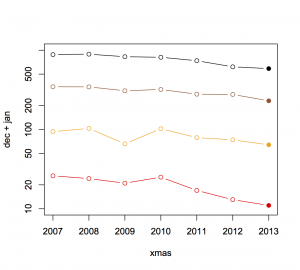
Here’s the trend for December and January, with the four lines showing all crashes where speed was a factor, those with any injury, those with a severe or fatal injury, and those with a fatality. The reduced-tolerance campaign was active for the last time period, December 2013 and January 2014. It looks as though the trend over years is pretty consistent.

during


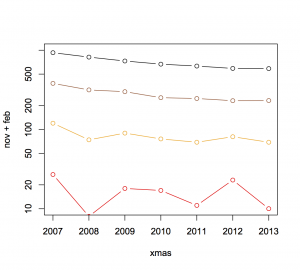
For comparison, here’s the trend in November and February, when there wasn’t a campaign running, again showing crashes where speed was listed in the database as a contributing cause, and with the four lines giving all, injury, severe or fatal, and fatal.

notduring

There really isn’t much sign that the trend was different last summer from recent years, or that the decrease was bigger in the months that had the campaign.  The trend of fewer crashes and fewer deaths has been going on for some time. Decreases in speeding are part of it, and the police have surely played an important role. That’s the context for assessing any new campaign: unless you have some reason to think last year was especially bad and the decrease would have stopped without the zero-tolerance policy, there isn’t much sign of an impact in the data.

The zero tolerance could be a permanent part of road policing, Mr Bush said.

“We’ll assess that at the end of the campaign, but I can’t see us changing our approach on that.”

No, I can’t either.

November 20, 2014

Round numbers

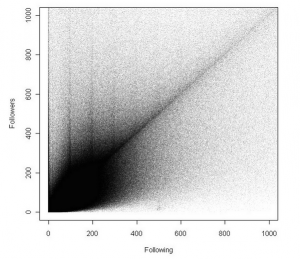
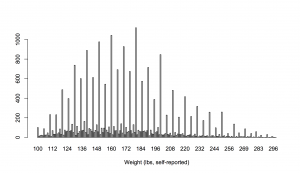
Nature doesn’t care about round numbers in base 10, but people do.  From @rcweir, via Amy Hogan, this is Twitter data of the number of people followed and following (truncated at 1000 to be readable). The number of people you follow is under your control, and there are clear peaks at multiples of 100 (and perhaps at multiples of 10 below 100). The number following you isn’t under your control, and there aren’t any similar patterns.

twit


For a medical example, here are self-reported weights from the US National Health Interview Survey

nhis-wt

The same thing happens with measured variables that are subject to operator error: blood pressure, for example, shows fairly strong digit preference unless a lot of care is taken in the measurement.

November 16, 2014

John Oliver on the lottery

When statisticians get quoted on the lottery it’s pretty boring, even if we can stop ourselves mentioning the Optional Stopping Theorem.

This week, though, John Oliver took on the US state lotteries: “..,more than Americans spent on movie tickets, music, porn, the NFL, Major League Baseball, and video games combined. “

(you might also look at David Fisher’s Herald stories on the lottery)

October 22, 2014

Screening the elderly

I’ve seen two proposals recently for population screening of older people. They’re probably both not good ideas, but for different reasons.

We had a Stat of the Week nomination for a proposal to screen people over 65 for depression at ordinary GP visits, to prevent suicide. The proposal was based on the fact that 70% of the suicides were in people who had visited a GP within the past month.  If the average person over 65 visits a GP less than about 8.5 times a year, this means those visiting their GP are at higher risk.  However, the risk is still very small: 225 over 5.5 years is 41/year, 70% of that is 29/year.

To identify those 29, it would be necessary to administer the screening question to a lot of people, at least hundreds of thousands. That in itself is costly; more importantly, since the questionnaire will not be perfectly accurate there will be  tens of thousands of positive results. For example, a US randomised trial of depression screening in people over 60 recruited 600 participants from 9000 people screened. In the ‘usual care’ half of the trial there were 3 completed suicides over the next two years; in those receiving more intensive and focused help with depression there were 2. The trial suggests that screening and intensive intervention does help with symptoms of major depression (probably at substantial cost), but it’s not likely to be a feasible intervention to prevent suicide.


The other proposal is from the UK, where GPs will be financially rewarded for dementia diagnoses. In contrast to depression, dementia is pretty much untreatable. There’s nothing that modifies the course of the disease, and even the symptomatic treatments are of very marginal benefit.

The rationale for the proposal is that early diagnosis gives patients and their families more time to think about options and strategies. That could be of some benefit, at least in the subset of people with dementia who are able and willing to talk about it, but similar advance planning could be done — and perhaps better — without waiting for a diagnosis.

Diagnosis isn’t like treatment. As a British GP and blogger, Martin Brunet, points out

We are used to being paid for things of course, like asthma reviews and statin prescribing, and we are well aware of the problems this causes – but at least patients can opt out if they don’t like it.

They can refuse to attend a review, decline our offer of a statin or politely take the pill packet and store it unopened in the kitchen cupboard. They cannot opt out of a diagnosis.


Infographic of the week

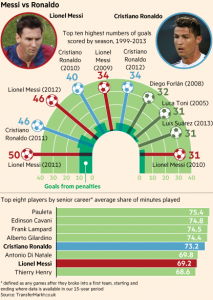
From the twitter of the Financial Times, “Interactive: who is the better goalscorer, Messi or Ronaldo?”

I assume on the FT site this actually is interactive, but since they have the world’s most effective paywall, I can’t really tell.

The distortion makes the bar graph harder to read, but it doesn’t matter much since the data are all there as numbers: the graph doesn’t play any important role in conveying the information. What’s strange is that the bent graph doesn’t really resemble any feature of a football pitch, which I  would have thought would be the point of distorting it.

B0cvaNfIEAA0WZH


The question of who has the highest-scoring season is fairly easy to read off, but the question of “who is the better goalscorer” is a bit more difficult. Based on the data here, you’d have to say it was too close to call, but presumably there’s other information that goes into putting Messi at the top of the ‘transfer value’ list at the site where the FT got the data.

(via @economissive)