The Herald has an interesting set of displays of the latest DigiPoll political opinion survey. According to the internets it was even worse earlier in the day, but we can pass over that and only point out that corrections in news stories shouldn’t happen silently (except perhaps for typos).
We can start with the standard complaint: the margin of error for the poll itself is 3.6%, so the margin of error for change since the last poll is 1.4 times higher, or a little over 5%. None of the changes is larger than 5%, and only one comes close.
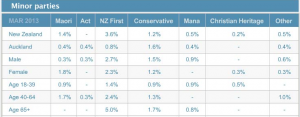
Secondly, there is a big table for the minor parties. I would normally not quote the whole table, but in this case it’s already changed once today.

The total reported for the minor parties is 6.1%, and since there were 750 people sampled, 46 of them indicated support for one of these parties. That’s not really enough to split up over 7 parties. These 46 then get split up further, by age and gender. At this point, some of the sample proportions are zero, displayed as “-” for some reason.
[Updated to add: and why does the one male 40-64 yr old Aucklander who supported ACT not show up in the New Zealand total?]
Approximately 1 in 7 New Zealanders is 65+, so that should be about 6 or 7 minor-party supporters in the sample. That’s really not enough to estimate a split over 7 parties. Actually, the poll appears to have been lucky in recruiting older folks: it looks like 6 NZ First, 2 Conservative, 1 Mana.
That’s all pretty standard overtabulating, but the interesting and creative problems happen at the bottom of the page. There’s an interactive graph, done with the Tableau data exploration software. From what I’ve heard, Tableau is really popular in business statistics: it gives a nice clear interface to selecting groups of cells for comparison, dropping dimensions, and other worthwhile data exploration activities, and helps analysts present this sort of thing to non-technical managers.
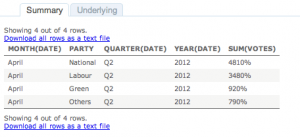
However, the setup that the Herald have used appears to be intended for counts or totals, not for proportions. For example, if you click on April 2012, and select View Data, you get

which is unlikely to improve anyone’s understanding of the poll.
I like interactive graphics. I’ve put a lot of time and effort into making interactive graphics. I’ve linked to a lot of good interactive graphics on this blog. The Herald has the opportunity to show the usefulness of interactive graphics to a much wider community that I’ll ever manage. But not this way.


