Posts filed under Polls (132)

March 31, 2014

Election poll averaging

The DimPost posted a new poll average and trend, which gives an opportunity to talk about some of the issues in interpretation (you should also listen to Sunday’s Mediawatch episode)

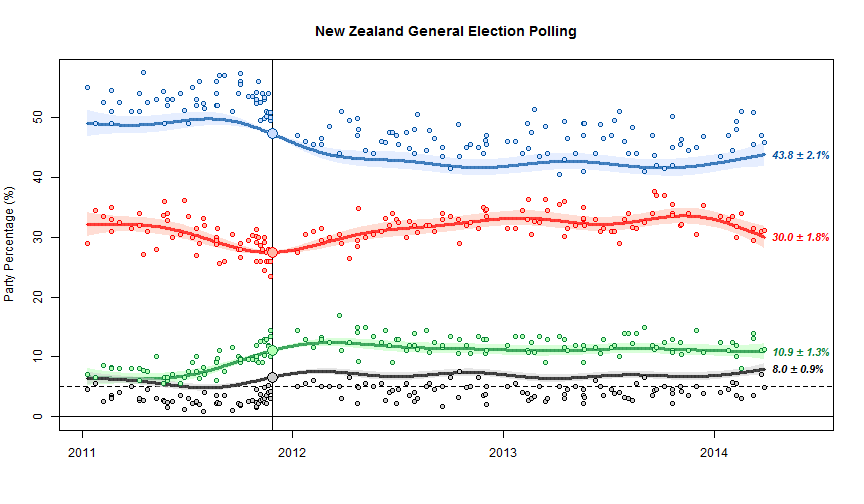
The basic chart looks like this

nzpolls20140330bc1

The scatter of points around the trend line shows the sampling uncertainty.  The fact that the blue dots are above the line and the black dots are below the line is important, and is one of the limitations of NZ polls.  At the last election, NZ First did better, and National did worse, than in the polling just before the election. The trend estimates basically assume that this discrepancy will keep going in the future.  The alternative, since we’ve basically got just one election to work with, is to assume it was just a one-off fluke and tells us nothing.

We can’t distinguish these options empirically just from the poll results, but we can think about various possible explanations, some of which could be disproved by additional evidence.  One possibility is that there was a spike in NZ First popularity at the expense of National right at the election, because of Winston Peters’s reaction to the teapot affair.  Another possibility is that landline telephone polls systematically undersample NZ First voters. Another is that people are less likely to tell the truth about being NZ First voters (perhaps because of media bias against Winston or something).  In the US there are so many elections and so many polls that it’s possible to estimate differences between elections and polls, separately for different polling companies, and see how fast they change over time. It’s harder here. (update: Danyl Mclauchlan points me to this useful post by Gavin White)

You can see some things about different polling companies. For example, in the graph below, the large red circles are the Herald-Digipoll results. These seem a bit more variable than the others (they do have a slightly smaller sample size) but they don’t seem biased relative to the other polls.  If you click on the image you’ll get the interactive version. This is the trend without bias correction, so the points scatter symmetrically around the trend lines but the trend misses the election result for National and NZ First.
poll-digipoll

March 25, 2014

Political polling code

The Research Association New Zealand  has put out a new code of practice for political polling (PDF) and a guide to the key elements of the code (PDF)

The code includes principles for performing a survey, reporting the results, and publishing the results, eg:

Conduct: If the political questions are part of a longer omnibus poll, they should be asked early on.

Reporting: The report must disclose if the questions were part of an omnibus survey.

Publishing: The story should disclose if the questions were part of an omnibus survey.

There is also some mostly good advice for journalists

  1. If possible, get a copy of the full poll  report and do not rely on a media release.
  2. The story should include the name of the company which conducted the poll, and the client the poll was done for, and the dates it was done.
  3.  The story should include, or make available, the sample size, sampling method, population sampled, if the sample is weighted, the maximum margin of error and the level of undecided voters.
  4. If you think any questions may have impacted the answers to the principal voting behaviour question, mention this in the story.
  5. Avoid reporting breakdown results from very small samples as they are unreliable.
  6. Try to focus on statistically significant changes, which may not just be from the last poll, but over a number of polls.
  7. Avoid the phrase “This party is below the margin of error” as results for low polling parties have a smaller margin of error than for higher polling parties.
  8.  It can be useful to report on what the electoral results of a poll would be, in terms of likely parliamentary blocs, as the highest polling party will not necessarily be the Government.
  9. In your online story, include a link to the full poll results provided by the polling company, or state when and where the report and methodology will be made available.
  10. Only use the term “poll” for scientific polls done in accordance with market research industry approved guidelines, and use “survey” for self-selecting surveys such as text or website surveys.

Some statisticians will disagree with the phrasing of point 6 in terms of statistical significance, but would probably agree with the basic principle of not ‘chasing the noise’

I’m not entirely happy with point 10, since outside politics and market research, “survey” is the usual word for scientific polls, eg, the New Zealand Income Survey, the Household Economic Survey, the General Social Survey, the National Health and Nutrition Examination Survey, the British Household Panel Survey, etc, etc.

As StatsChat readers know, I like the term “bogus poll” for the useless website clicky surveys. Serious Media Organisations who think this phrase is too frivolous could solve the problem by not wasting space on stories about bogus polls.

March 22, 2014

Polls and role-playing games

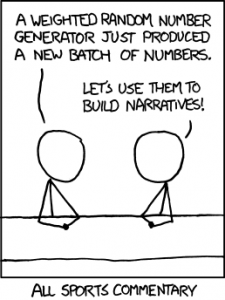
An XKCD classic

sports


The mouseover text says “Also, all financial analysis. And, more directly, D&D.” 

We’re getting to the point in the electoral cycle where opinion polls qualify as well. There will be lots of polls, and lots media and blog writing that tries to tell stories about the fluctuations from poll to poll that fit in with their biases or their need to sell advertising. So, as an aid to keeping calm and believing nothing, I thought a reminder about variability would be useful.

The standard NZ opinion poll has 750-1000 people. The ‘maximum margin of error’ is about 3.5% for 730 and about 3% for 1000. If the poll is of a different size, they will usually quote the maximum margin of error. If you have 20 polls, 19 of them should get the overall left:right division to within the maximum margin of error.

If you took 3.5% from the right-wing coalition and moved it to the left-wing coalition, or vice versa, you’d change the gap between them by 7% and get very different election results, so getting this level of precision 19 times out of 20 isn’t actually all that impressive unless you consider how much worse it could be. And in fact, polls likely do a bit worse than this: partly because voting preferences really do change, partly because people lie, and partly because random sampling is harder than it looks.

Often, news headlines are about changes in a poll, not about a single poll. The uncertainty in a change is  higher than in a single value, because one poll might have been too low and the next one too high.  To be precise, the uncertainty is 1.4 times higher for a change.  For a difference between two 750-person polls, the maximum margin of error is about 5%.

You might want a less-conservative margin than 19 out of 20. The `probable error’ is the error you’d expect half the time. For a 750-person poll the probable error is 1.3% for a single party and single poll,  2.6% for the difference between left and right in a single poll, and 1.9% for a difference between two polls for the same major party.

These are all for major parties.  At the 5% MMP threshold the margin of error is smaller: you can be pretty sure a party polling below 3.5% isn’t getting to the threshold and one polling about 6.5% is, but that’s about it.

If a party gets an electorate seat and you want to figure out if they are getting a second List seat, a national poll is not all that helpful. The data are too sparse, and the random sampling is less reliable because minor parties tend to have more concentrated support.   At 2% support the margin of error for a single poll is about 1% each way.

Single polls are not very useful, but multiple polls are much better, as the last US election showed. All the major pundits who used sensible averages of polls were more accurate than essentially everyone else.  That’s not to say experts opinion is useless, just that if you have to pick just one of statistical voodoo and gut instinct, statistics seems to work better.

In NZ there are several options. Peter Green does averages that get posted at Dim Post; his code is available. KiwiPollGuy does averages and also writes about the iPredict betting markets, and pundit.co.nz has a Poll of Polls. These won’t work quite as well as in the US, because the US has an insanely large number of polls and elections to calibrate them, but any sort of average is a big improvement over looking one poll at a time.

A final point: national polls tell you approximately nothing about single-electorate results. There’s just no point even looking at national polling results for ACT or United Future if you care about Epsom or Ohariu.

March 20, 2014

Beyond the margin of error

From Twitter, this morning (the graphs aren’t in the online story)

Now, the Herald-Digipoll is supposed to be a real survey, with samples that are more or less representative after weighting. There isn’t a margin of error reported, but the standard maximum margin of error would be  a little over 6%.

There are two aspects of the data that make it not look representative. Thr first is that only 31.3%, or 37% of those claiming to have voted, said they voted for Len Brown last time. He got 47.8% of the vote. That discrepancy is a bit larger than you’d expect just from bad luck; it’s the sort of thing you’d expect to see about 1 or 2 times in 1000 by chance.

More impressively, 85% of respondents claimed to have voted. Only 36% of those eligible in Auckland actually voted. The standard polling margin of error is ‘two sigma’, twice the standard deviation.  We’ve seen the physicists talk about ‘5 sigma’ or ‘7 sigma’ discrepancies as strong evidence for new phenomena, and the operations management people talk about ‘six sigma’ with the goal of essentially ruling out defects due to unmanaged variability.  When the population value is 36% and the observed value is 85%, that’s a 16 sigma discrepancy.

The text of the story says ‘Auckland voters’, not ‘Aucklanders’, so I checked to make sure it wasn’t just that 12.4% of the people voted in the election but didn’t vote for mayor. That explanation doesn’t seem to work either: only 2.5% of mayoral ballots were blank or informal. It doesn’t work if you assume the sample was people who voted in the last national election.  Digipoll are a respectable polling company, which is why I find it hard to believe there isn’t a simple explanation, but if so it isn’t in the Herald story. I’m a bit handicapped by the fact that the University of Texas internet system bizarrely decides to block the Digipoll website.

So, how could the poll be so badly wrong? It’s unlikely to just be due to bad sampling — you could do better with a random poll of half a dozen people. There’s got to be a fairly significant contribution from people whose recall of the 2013 election is not entirely accurate, or to put it more bluntly, some of the respondents were telling porkies.  Unfortunately, that makes it hard to tell if results for any of the other questions bear even the slightest relationship to the truth.


January 2, 2014

Toll, poll, and tolerance.

The Herald has a story that  has something for everyone.  On the front page of the website it’s labelled “Support for lower speed limit“, but when you click through it’s actually about the tighter tolerance (4km/h, rather than 10km/h) for infringement notices being used on the existing speed limits.

The story is about a real poll, which found about 2/3 support for the summer trial of tighter speed limits. Unfortunately, the poll seems to have had really badly designed questions. Either that, or the reporting is jumping to unsupportable conclusions:

The poll showed that two-thirds of respondents felt that the policy was fair because it was about safety. Just 29 per cent said that it was unfair and was about raising revenue.

That is, apparently the alternatives given for respondents combined both whether they approved of the policy and what they thought the reason was.  That’s a bad idea for two reasons. Firstly, it confuses the respondents, when it’s hard enough getting good information to begin with. Secondly, it pushes them towards an answer.   The story is decorated with a bogus clicky poll, which has a better set of questions, but, of course, largely meaningless results.

The story also quotes the Police Minister attributing a 25% lower death toll during  the Queen’s Birthday weekends to the tighter tolerance

“That means there is an average of 30 people alive today who can celebrate Christmas who might not otherwise have been,” Mrs Tolley said.

We’ve looked at this claim before. It doesn’t hold up. Firstly, there has been a consistently lower road toll, not just at holiday weekends.  And secondly, the Ministry of Transport says that driving too fast for the conditions is a only even one of the contributing factors in 29% of fatal crashes, so getting a 25% reduction in deaths just from tightening the tolerance seems beyond belief.  To be fair, the Minister only said the policy “contributed” to the reduction, so even one death prevented would technically count, but that’s not the impression being given.

What’s a bit depressing is that none of the media discussion I’ve seen of the summer campaign has asked what tolerance is actually needed, based on accuracy of speedometers and police speed measurements. And while stories mention that the summer campaign is a trial run to be continued if it is successful, no-one seems to have asked what the evaluation criteria will be and whether they make sense.

(suggested by Nick Iversen)

January 1, 2014

I can haz public opinion?

Usually it’s a problem for opinion polls that respondents tend to answer based on political or group affiliation rather than their actual opinion about the real issue.  Today’s Herald has a poll where that’s basically the point. This is a real poll, not one of those bogus clicky things, but the question was “Who would you trust most to feed you cat over the holidays?”

cat

Now, to start with, just over half of NZ households do not haz cat, so the question is pretty meaningless for them. Even for the 48% with feline overlords,  the answers supplied didn’t include anyone you might actually get to feed your cat over the holidays. (And isn’t the kitten in the photo a bit young to be left alone like that?)

The choices were one MP (out of 121), one big-city mayor (out of, say, four to six), one internet celebrity (out of an indeterminate set), and one former MP and climate-change denier. No women. No-one on the paper’s New Zealanders of the Year list. Unsurprisingly, one in three of the people they managed to get to answer the question looked at the options and said something along the lines of “Do not want”. 

It’s unusual for a statistician to say this, but sometimes getting a properly representative sample doesn’t really help all that much. The one person on the list who is actually known for his commitment to animal welfare came last.

(picture via @ChrisKeall)

December 6, 2013

If New Zealand were a village of 100 people ….

… according to the 2013 Census figures,

  • 51 would be female, 49 male.
  • 70 would be European, 14 Maori and 11 Asian.
  • 24 would have been born overseas
  • 21 would have a tertiary qualification
  • 4 would be unemployed.
  • 4 would earn over $100,000

Statistics New Zealand has done a nice graphic of the above, too. Full 2013 Census info available here.


December 3, 2013

Silliness on both sides in the Waikato fluoride stoush

The anti-fluoride Fluoride Action Network has accused the Waikato Times of reversing the results of an online poll that asked whether people supported the council’s move to defer re-fluoridating the city’s water supply until a High Court legal challenge  is decided.

What the Waikato Times did or didn’t do is immaterial. Folks, the paper ran a self-selecting online poll, which makes its results utterly meaningless.

The best poll we have on this is October’s non-binding referendum. It showed that nearly 70% of Hamilton voters favoured water fluoridation.

September 30, 2013

For advertising purposes only

Bogus polls are only useful for advertising, but as long as they are honest about it, that’s not a problem.

As a meritorious example, consider Forest & Bird’s Bird of the Year poll, which starts today. It exists to raise awareness of NZ birds and to get stories in the media about them, but it’s not claiming to be anything else.

At the time of writing, the kereru, ruru, and albatross were tied for first place. They’ve got more security to prevent multiple voting than the newspapers do — you can only vote once per email address — but it’s still just a self-selected poll of a tiny fraction of the population.

Radio NZ science broadcaster Allison Ballance is lobbying for the albatross, which is an excellent choice, but the only official StatsChat advice is to watch out for the penguins.

September 25, 2013

Just one poll

A recurring point on StatsChat is that single election polls don’t have a large enough sample size to track short-term changes in opinion. Some form of averaging is necessary.

The excuse for pointing this out again is the Herald-Digipoll result with an increase of 6.8% since the previous poll in June. Since the poll has a 3.6% margin of error for a single estimate, its margin of error for changes is about 5%, so 6.8% is quite impressive.

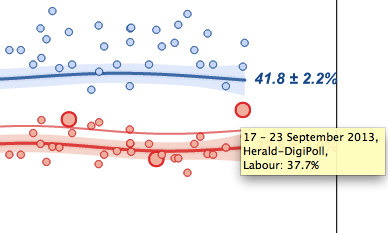
On the other hand, Danyl Mclauchlan just tweeted a nice interactive plot of aggregrated poll results. I can’t embed it because WordPress is scared of SVG graphics, but the key chunk is here and you can click for the interactive plot

polls


The highlighted points are past Herald-DigiPoll results, and there is indeed a big jump since June, but there’s almost no change since March. This poll seems to have given more variable results for Labour than the other polls do.

The conclusion: it’s too early to tell whether the change of management at Labour has affected opinion. But it’s probably more than a year until the election. We can wait a few weeks for the polls.


[Update: I’m apparently wrong about the excess variability in the Labour results, according to Peter Green on Twitter. Statisticians can overinterpret numbers just as much as the next guy]

[Further update: Twittering establishes that all the obvious suggestions for potentially-better ways to smooth the data have been tried.]