Posts filed under Polls (132)

February 26, 2012

Students ‘flee NZ’

From the Herald (and via a Stat of the Summer submission), a story on students leaving NZ because of job fears.  According to the poll, students are more likely to be worried about getting a job when they finish than about their next rent bill or next decent meal. That’s what you’d hope, and it doesn’t really seem surprising.

We aren’t told whether the students planning to head overseas are the ones worried about getting a job here, or whether they’re the ones who could easily get a job in NZ but looking for higher pay or new surroundings.  In fact, it’s worse than that.  The story says

While a third planned on moving straight into career mode after study,…18 per cent were heading overseas – either for work or timeout.

That is, the 18% planning to head overseas includes all the ones aiming for time off and foreign travel.  This means there is absolutely no support in the story for the headline claim that students are leaving NZ because of job fears.

The other interesting part about the story is the attribution: “an online Colmar Brunton survey of more than 1000 students conducted on behalf of Student Job Search.”  That sounds like it’s one of the surveys from saywhat.co.nz, a site where people aged 15-30 can sign up to do fill in questionnaires for the chance to win prizes.   It’s hard to tell how accurate these polls are: they are a self-selected sample, but the respondents do have to give some personal information that could help adjust for the selection bias. The website uses age and gender as examples, which would be completely inadequate, but they may collect more useful information in the sign-up process (or, of course, by mining it from Facebook and the like).
 

February 12, 2012

Vote early, vote often

The West Island seems to have an even worse problem with bogus polls than we do.  The Sydney Morning Herald carried an article on the Friends of Science in Medicine, and their campaign to have medical degrees only teach stuff that actually, you know, works. This article was accompanied by a poll.  According to the poll, 230% of readers of the article wanted alternative medicine taught in medical degrees, and the other 570% didn’t.  That is, eight times as many people voted as read the article.

It gets better.  The SMH followed up with a story about the poll rigging, and for some reason included a new poll asking whether people regarded website poll results as serious, vaguely informative, purely for entertainment, or misleading.    Yesterday morning “Serious” had 87% of the vote.  Now it’s 95%, with vote totals almost as high as the previous inflated figures.

If you’re even tempted to believe bogus media website polls, we have a bridge we can name after you.

[thanks for the link, Brendon]

January 29, 2012

Bogus polls compared

The Crafar farms decision has inspired multiple bogus polls asking whether it was the right decision, which gives us an opportunity for comparisons.

Current or recent polls include:

  • NZ Herald: 34% in favour of the decision
  • Stuff: 22% in favour
  • Campbell Live: 3% in favour

(I would link, but these polls tend to disappear quickly from web pages. The pre-decision polls already seem to be gone. )

The Stuff and NZ Herald polls both claim about 18000 votes. If this were a real poll, the maximum margin of error would be under 1%. Clearly the actual error is at least 19%, and quite possibly more.

If the true proportion was about 20% (as in the real poll taken late last year) and you had a real poll with a sample size of just ten you would have a 3 in 4 chance of getting within 10% of the true answer.  The chance of having a 30% spread over three polls of size ten would be only 1 in 5.  So, on this issue, the self-selected polls are worse than a random sample of just ten people.  You can see why we like the term ‘bogus’.

Bogus polls are worse than useless because of anchoring bias. Seeing the results is likely to make your beliefs less accurate, even if you know the information content is effectively zero.


January 26, 2012

Another smoking survey

Today it’s Hamilton’s turn:

A survey of 111 residents at Hamilton Lake and Innes Common playgrounds, the city bus station and Waikato University in mid-2011 found 94 per cent wanted children’s playgrounds to be smokefree.

This is much more sensible than the website poll on Auckland’s initiative that was magically translated into “a majority of New Zealanders”.

The poll will be a biased sample of the population, because it will over-represent people who go to children’s playgrounds, but it’s perfectly reasonable for them to have more say about smoking there.   I assume (I have to assume, because the facts aren’t given) that the survey also asked if the bus station and the University campus should be smoke-free, and that the results were less favorable.

We also aren’t told who did the survey, and what the questions were.   You might get quite different responses for a survey conducted by the Council and one conducted by the Cancer Society.

Even accounting for this, it looks as though there’s a lot of support, and I’d say the poll qualifies as not completely useless.

January 20, 2012

Bogus smoking poll.

From the NZ Herald

Auckland councillors are divided over a proposed smoking ban in public outdoor areas, but the majority of New Zealanders say the idea is either sensible or good in theory.

If you read the article, it turns out that the claim about the majority of New Zealanders is based on the clicky poll on the Herald website.  That is, the data come from what the newspapers ordinarily call “an unscientific poll”, and we at StatsChat prefer to call “a bogus poll“.   Last week I criticised the Drug Foundation online poll results as ‘dodgy numbers’.  This is well beyond ‘dodgy’.

In the Drug Foundation poll, the point was that a non-negligible fraction of people believed drug driving was safe, and the poll provided at least some support for the argument even if the numbers were unreliable.  And the Drug Foundation collected a lot of demographic information so it was possible to say something about the ways in which the sample was biased.

In this example it really matters whether the support is, say , 40% or 70%, and we have no idea of the extent of the bias, except that there are probably responses from people outside Auckland.

If a ban on smoking in public outdoor areas had sufficiently strong majority support (perhaps 2/3 majority), I wouldn’t necessarily be against it, but we need real numbers, based on real opinions of a concrete plan.

January 18, 2012

Who you gonna call? part 2

Nate Silver, at the fivethirtyeight blog at the New York Times, writes

On Saturday, a survey came out showing Mitt Romney with a large, 21-point lead in South Carolina. The poll is something of an outlier relative to other recent polls of the state, all of which show Mr. Romney ahead, but by margins ranging from 2 to 9 points.

The poll, conducted by Ipsos for Reuters, has already attracted more than 200 citations in the mainstream media. Most of these articles, however, neglected to mention a key detail: in a break with Ipsos’ typical methodology, the survey was conducted online….

He goes on to give a good description of the problems with online polling and how the results match up to other techniques in election polls, where there is good evidence of comparability.  These online polls aren’t the `unscientific’ (aka ‘bogus’ web page surveys) we’ve complained about before, they are from polling companies who are at least trying to look accurate.

What Nate Silver doesn’t discuss further is the very large media coverage received by the anomalous poll. If you want election nerds to take you seriously it helps to get the same results as the other polls, but if you want to be newsworthy, it’s better to get very different results.  And since Mr Romney is highly likely to win the presidential nomination, an error that overestimates his popularity will be forgotten in the long run.

January 5, 2012

Polling terminology

We’ve commented before on the annoying tendency of newspapers to claim that self-selected website polls actually mean something.  The media usually refers to the results as coming from “an unscientific poll”, but a better term would be “a bogus poll”.  In the interests of openness, democracy, and giving you something to do over summer, we are conducting a bogus poll ourselves, to find out which terminology is better.


December 13, 2011

Below the margin of error

“a policy which recognises that individuals are the owners of their own lives, and which probably has the potential to win broad support at a time when they’re polling below the margin of error” – NZ Classic Liberal

“Radio Rhema, Inferno, Solid Gold, Radio Live, Sunday News,  and Herald On Sunday all rate below the margin of error” – Greater Queenstown/Arrowtown Media Survey

“Whether our party does well, or remains mired below the margin of error, there is little doubt that libertarian ideas are slowly diffusing into the public consciousness.” – Sean Fitzpatrick, Libertarianz

“Given that ACT was last polling below the margin of error, their opinions, flattering or otherwise, hardly seem likely to sway the result.” – The Northland Age.

“Look at Huntsman running below 2 percent. He is running below the margin of error. That’s how bad he’s doing. He may actually have zero or owe somebody votes.” – Dean Obeidallah

Dean Obeidallah is a professional comedian, and he knows it’s a joke.  The others seem to be serious, though they may just mean “very small” rather than anything more precise.

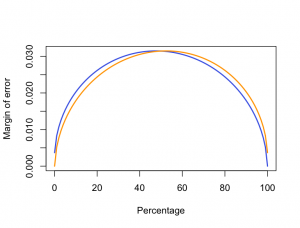
Careful pollers refer to the uncertainty margin they routinely quote as the “maximum margin of error”.  Unfortunately the first word gets left off by most people who quote the results.   The maximum margin of error in a poll is the margin of error in an estimate of 50%.   That’s fine for the major parties, but if you want to know how many people support Winston Peters, or how many believe they have been abducted by aliens, you need a different formula.

Since proportions can’t be negative, and since any non-zero percentage in a poll implies a non-zero percentage in the population, the uncertainty must be smaller for percentages near zero or one hundred.  The uncertainty range must also be asymmetric: a 1% result can’t overestimate the truth by more than 1%, but it could underestimate the truth by more than 1%.

The graph shows the upper (blue) and lower (orange) margins of error for percentages from 0 to 100% in a poll of 1000 people, the size that Colmar Brunton typically uses.  Over the range from about 20% to 80% the curve is pretty flat, and using the maximum margin of error is a good approximation.  For values less than 10% or more than 90% we need a better rule of thumb.

Some rough approximations that might be useful:

  • At 10%, the margin of error is about two-thirds of the maximum
  • At 5%, the crucial MMP threshold, the margin of error is about half the maximum
  • For percentages greater than zero but less than the maximum margin of error, the relative margin of error is roughly 50%
  • If the percentage is zero there isn’t any margin of error downwards, but the upper margin of error is 3 divided by the sample size (eg 3/1000=0.3% for a sample of 1000).

The first two of these rules of thumb come from the formula for the variance  of a proportion p, which is p(1-p)/n for a sample size of n. The maximum margin of error is the square root of 1/n, so we can work out n easily.

The last rule is the famous rule of three: if you see none of something, the upper bound for the proportion is the same as the estimate if you had seen three of them.

The third rule is a rough approximation based on looking at some numbers, and is less accurate than the others.

November 30, 2011

Half of what?

The sesquipedalian accounting company PwC has a new business fraud report, claiming that half of all NZ businesses have been victims. This is from a survey with 93 Kiwi respondents, including some businesses with even fewer than 200 employees.

The obvious problem is that large businesses have many more employees and are much more likely to have at least one case of fraud.  Small businesses, of which there are many, are vastly under-represented.  A more dramatic example from a few months back was the claim by the US National Retail Federation that 10% of companies it polled had been victims of a ‘flash mob’ attack.   That’s not 10% of stores, that’s 10% of a sample of 106 companies including BP, Sears, and North Face.

The claim that fraud is on the rise could still be supported by the data, as long as the same methodology was used now as in the past, but the reported change from 42% to 49.5% would be well within the margin of error if the 2009 survey was the same size as the new one.

PwC’s Alex Tan explains the rise as “We’re a relatively low-wage economy but we like high-wage living.”  This certainly isn’t a result of the poll — they didn’t poll the perpetrators to ask why they did it — and it sounds rather like the classic fallacy of explaining a variable by a constant.   New Zealand is a relatively low wage country, but we were a relatively low wage country in 2009 as well, and even before that.  Baches are expensive now, but they were expensive in 2009, and even before that.   If low wages and expensive tastes are overcoming Kiwis’ moral fibre this year, how did they resist two years ago?

Averages and diversity

The NZ Herald has a headlineLittle diversity in New Zealand’s average politician“.Of course there’s little diversity in an average — that’s what a one-number summary is for — but the article is mostly about representativeness.

The article says that the typical MP “was a straight European man, from the North Island, aged in his 50s”.  If we compare MPs to other people in full-time employment, we see that they are also most likely to be straight, European, male, and from the North Island, though younger than 50.

The interesting question is which groups are under-represented, and why.   MPs are substantially older than the rest of the employed population. Women are substantially under-represented. Maori are slightly over-represented relative to their population, which is by the design of the electoral system.  Pacific Islanders and Asians are under-represented, by a large enough margin that it’s not entirely due to some migrants only being residents, and so eligible to vote but not to stand for election. And at 95%, straight people are slightly under-represented.