Posts filed under Politics (193)

May 21, 2015

Fake data in important political-science experiment

Last year, a research paper came out in Science demonstrating an astonishingly successful strategy for gaining support for marriage equality: a short, face-to-face personal conversation with a gay person affected by the issue. As the abstract of the paper said

Can a single conversation change minds on divisive social issues, such as same-sex marriage? A randomized placebo-controlled trial assessed whether gay (n = 22) or straight (n = 19) messengers were effective at encouraging voters (n = 972) to support same-sex marriage and whether attitude change persisted and spread to others in voters’ social networks. The results, measured by an unrelated panel survey, show that both gay and straight canvassers produced large effects initially, but only gay canvassers’ effects persisted in 3-week, 6-week, and 9-month follow-ups. We also find strong evidence of within-household transmission of opinion change, but only in the wake of conversations with gay canvassers. Contact with gay canvassers further caused substantial change in the ratings of gay men and lesbians more generally. These large, persistent, and contagious effects were confirmed by a follow-up experiment. Contact with minorities coupled with discussion of issues pertinent to them is capable of producing a cascade of opinion change.

Today, the research paper is going away again. It looks as though the study wasn’t actually done. The conversations were done: the radio program “This American Life” gave a moving report on them. The survey of the effect, apparently not so much. The firm who were supposed to have done the survey deny it, the organisations supposed to have funded it deny it, the raw data were ‘accidentally deleted’.

This was all brought to light by a group of graduate students who wanted to do a similar experiment themselves. When they looked at the reported data, it looked strange in a lot of ways (PDF). It was of better quality than you’d expect: good response rates, very similar measurements across two cities,  extremely good before-after consistency in the control group. Further investigation showed before-after changes fitting astonishingly well to a Normal distribution, even for an attitude measurement that started off with a huge spike at exactly 50 out of 100. They contacted the senior author on the paper, an eminent and respectable political scientist. He agreed it looked strange, and on further investigation asked for the paper to be retracted. The other author, Michael LaCour, is still denying any fraud and says he plans to present a comprehensive response.

Fake data that matters outside the world of scholarship is more familiar in medicine. A faked clinical trial by Werner Bezwoda led many women to be subjected to ineffective, extremely-high-dose chemotherapy. Scott Reuben invented all the best supporting data for a new approach to pain management; a review paper in the aftermath was titled “Perioperative analgesia: what do we still know?”  Michael LaCour’s contribution, as Kieran Healy describes, is that his approach to reducing prejudice has been used in the Ireland marriage equality campaign. Their referendum is on Friday.

April 14, 2015

Northland school lunch numbers

Last week’s Stat of the Week nomination for the Northern Advocate didn’t, we thought point out anything particularly egregious. However, it did provoke me to read the story — I’d previously only  seen the headline 22% statistic on Twitter.  The story starts

Northland is in “crisis” as 22 per cent of students from schools surveyed turn up without any or very little lunch, according to the Te Tai Tokerau Principals Association.

‘Surveyed’ is presumably a gesture in the direction of the non-response problem: it’s based on information from about 1/3 of schools, which is made clear in the story. And it’s not as if the number actually matters: the Te Tai Tokerau Principals Association basically says it would still be a crisis if the truth was three times lower (ie, if there were no cases in schools that didn’t respond), and the Government isn’t interested in the survey.

More evidence that number doesn’t matter is that no-one seems to have done simple arithmetic. Later in the story we read

The schools surveyed had a total of 7352 students. Of those, 1092 students needed extra food when they came to school, he said.

If you divide 1092 by 7352 you don’t get 22%. You get 15%.  There isn’t enough detail to be sure what happened, but a plausible explanation is that 22% is the simple average of the proportions in the schools that responded, ignoring the varying numbers of students at each school.

The other interesting aspect of this survey (again, if anyone cared) is that we know a lot about schools and so it’s possible to do a lot to reduce non-response bias.  For a start, we know the decile for every school, which you’d expect to be related to food provision and potentially to response. We know location (urban/rural, which district). We know which are State Integrated vs State schools, and which are Kaupapa Māori. We know the number of students, statistics about ethnicity. Lots of stuff.

As a simple illustration, here’s how you might use decile and district information.  In the Far North district there are (using Wikipedia because it’s easy) 72 schools.  That’s 22 in decile one, 23 in decile two, 16 in decile three, and 11 in deciles four and higher.  If you get responses from 11 of the decile-one schools and only 4 of the decile-three schools, you need to give each student in those decile-one schools a weight of 22/11=2 and each student in the decile-three schools a weight of 16/4=4. To the extent that decile predicts shortage of food you will increase the precision of your estimate, and to the extent that decile also predicts responding to the survey you will reduce the bias.

This basic approach is common in opinion polls. It’s the reason, for example, that the Green Party’s younger, mobile-phone-using support isn’t massively underestimated in election polls. In opinion polls, the main limit on this reweighting technique is the limited amount of individual information for the whole population. In surveys of schools there’s a huge amount of information available, and the limit is sample size.

March 31, 2015

Polling in the West Island: cheap or good?

New South Wales has just voted, and the new electorate created where I lived in Sydney 20 years ago is being won by the Greens, who got 46.4% of the primary vote and currently 59.7% on preferences. The ABC News background about the electorate says

In 2-party preferred terms this is a safe Labor seat with a margin of 13.7%, but in a two-candidate contest would be a marginal Green seat versus Labor. The estimated first preference votes based on the 2011 election are Green 35.5%, Labor 30.4%, Liberal 21.0%, Independent 9.1, the estimated Green margin after preferences being 4.4% versus Labor.

There was definitely a change since 2011 in this area, so how did the polls do? Political polling is a bit harder with preferential voting when there are only two relevant parties, but much harder when there are more than two.

Well, the reason for mentioning this is a piece in the Australian saying that the swing to the Greens caught Labor by surprise because they’d used cheap polls for electorate-specific prediction

“We just can’t poll these places accurately at low cost,” a Labor strategist said. “It’s too hard. The figures skew towards older voters on landlines and miss younger voters who travel around and use mobile phones.”

The company blamed in the story is ReachTEL. They report that they had the most accurate overall results, but their published poll from 19 March for Newtown is definitely off a bit, giving the Greens 33.3% support.

(via Peter Green on Twitter)


March 25, 2015

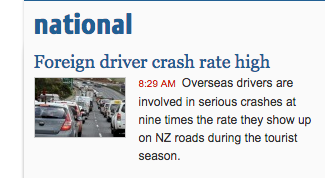
Foreign drivers, yet again

From the Stuff front page

ninetimes

Now, no-one (maybe even literally no-one) is denying that foreign drivers are at higher risk on average. It’s just that some of us feel exaggerating the problem is unhelpful. The quoted sentence is true only if “the tourist season” is defined, a bit unconventionally, to mean “February”, and probably not even then.

When you click through to the story (from the ChCh Press), the first thing you see is this:

1427225389525

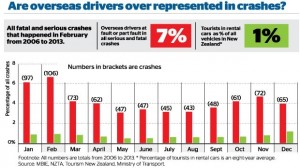
Notice how the graph appears to contradicts itself: the proportion of serious crashes contributed to by a foreign driver ranges from just over 3% in some months to just under 7% at the peak.  Obviously, 7% is an overstatement of the actual problem, and if you read sufficiently carefully, the graphs says so.  The average is actually 4.3%

The other number headlined here is 1%: cars rented by tourists as a fraction of all vehicles.  This is probably an underestimate, as the story itself admits (well, it doesn’t admit the direction of the bias). But the overall bias isn’t what’s most relevant here, if you look at how the calculation is done.

Visitor surveys show that about 1 million people visited Canterbury in 2013.

About 12.6 per cent of all tourists in 2013 drove rental cars, according to government visitor surveys. That means about 126,000 of those 1 million Canterbury visitors drove rental cars. About 10 per cent of international visitors come to New Zealand in January, which means there were about 12,600 tourists in rental cars on Canterbury roads in January.

This was then compared to the 500,000 vehicles on the Canterbury roads in 2013 – figures provided by the Ministry of Transport.

The rental cars aren’t actually counted, they are treated as a constant fraction of visitors. If visitors in summer are more likely to drive long distances, which seems plausible, the denominator will be relatively underestimated in summer and overestimated in winter, giving an exaggerated seasonal variation in risk.

That is, the explanation for more crashes involving foreign drivers in summer could be because summer tourists stay longer or drive more, rather than because summer tourists are intrinsically worse drivers than winter tourists.

All in all, “nine times higher” is a clear overstatement, even if you think crashes in February are somehow more worth preventing than crashes in other months.

Banning all foreign drivers from the roads every February would have prevented 106 fatal or serious injury crashes over the period 2006-2013, just over half a percent of the total.  Reducing foreign driver risk by 14%  over the whole year would have prevented 109 crashes. Reducing everyone’s risk by 0.6%  would have prevented about 107 crashes. Restricting attention to February, like restricting attention to foreign drivers, only makes sense to the extent that it’s easier or less expensive to reduce some people’s risk enormously than to reduce everyone’s risk a tiny amount.


Actually doing something about the problem requires numbers that say what the problem actually is, and strategies, with costs and benefits attached. How many tens of millions of dollars worth of tourists would go elsewhere if they weren’t allowed to drive in New Zealand? Is there a simple, quick test would separate safe from dangerous foreign drivers, that rental companies could administer? How could we show it works? Does the fact that rental companies are willing to discriminate against young drivers but not foreign drivers mean there’s something wrong with anti-discrimination law, or do they just have a better grip on the risks? Could things like rumble strips and median barriers help more for the same cost? How about more police presence?

From 2006 to 2013 NZ averaged about 6 crashes per day causing serious or fatal injury. On average, about one every four days involved a foreign driver. Both these numbers are too high.


March 17, 2015

Bonus problems

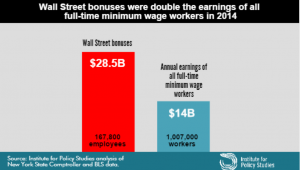
If you hadn’t seen this graph yet, you probably would have soon.

bonuses CAQYEF4UYAA5PqA

The claim “Wall Street bonus were double the earnings of all full-time minimum wage workers in 2014” was made by the Institute for Policy Studies (which is where I got the graph) and fact-checked by the Upshot blog at the New York Times, so you’d expect it to be true, or at least true-ish. It probably isn’t, because the claim being checked was missing an important word and is using an unfortunate definition of another word. One of the first hints of a problem is the number of minimum wage workers: about a million, or about 2/3 of one percent of the labour force.  Given the usual narrative about the US and minimum-wage jobs, you’d expect this fraction to be higher.

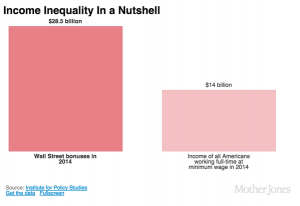
The missing word is “federal”. The Bureau of Labor Statistics reports data on people paid at or below the federal minimum wage of $7.25/hour, but 29 states have higher minimum wages so their minimum-wage workers aren’t counted in this analysis. In most of these states the minimum is still under $8/hr. As a result, the proportion of hourly workers earning no more than federal minimum wage ranges from 1.2% in Oregon to 7.2% in Tennessee (PDF).  The full report — and even the report infographic — say “federal minimum wage”, but the graph above doesn’t, and neither does the graph from Mother Jones magazine (it even omits the numbers of people)

On top of those getting state minimum wage we’re still short quite a lot of people, because “full-time” is defined by 35 or more hours per week at your principal job.  If you have multiple part-time jobs, even if you work 60 or 80 hours a week, you are counted as part-time and not included in the graph.

Matt Levine writes:

There are about 167,800 people getting the bonuses, and about 1.03 million getting full-time minimum wage, which means that ballpark Wall Street bonuses are 12 times minimum wage. If the average bonus is half of total comp, a ratio I just made up, then that means that “Wall Street” pays, on average, 24 times minimum wage, or like $174 an hour, pre-tax. This is obviously not very scientific but that number seems plausible.

That’s slightly less scientific than the graph, but as he says, is plausible. In fact, it’s not as bad as I would have guessed.

What’s particularly upsetting is that you don’t need to exaggerate or use sloppy figures on this topic. It’s not even that controversial. Lots of people, even technocratic pro-growth economists, will tell you the US minimum wage is too low.  Lots of people will argue that Wall St extracts more money from the economy than it provides in actual value, with much better arguments than this.

By now you might think to check carefully that the original bar chart is at least drawn correctly.  It’s not. The blue bar is more than half the height of the red bar, not less than half.

March 14, 2015

Ok, but it matters in theory

Some discussion on Twitter about political polling and whether political journalists understood the numbers led to the question:

If you poll 500 people, and candidate 1 is on 35% and candidate 2 is on 30%, what is the chance candidate 2 is really ahead?

That’s the wrong question. Well, no, actually it’s the right question, but it is underdetermined.

The difficulty is related to the ‘base-rate‘ problem in testing for rare diseases: it’s easy to work out the probability of the data given the way the world is, but you want the probability the world is a certain way given the data. These aren’t the same.

If you want to know how much variability there is in a poll, the usual ‘maximum margin of error’ is helpful.  In theory, over a fairly wide range of true support, one poll in 20 will be off by more than this, half being too high and half being too low. In theory it’s 3% for 1000 people, 4.5% for 500. For minor parties, I’ve got a table here. In practice, the variability in NZ polls is larger than in theoretically perfect polls, but we’ll ignore that here.

If you want to know about change between two polls, the margin of error is about 1.4 times higher. If you want to know about difference between two candidates, the computations are trickier. When you can ignore other candidates and undecided voters, the margin of error is about twice the standard value, because a vote added to one side must be taken away from the other side, and so counts twice.

When you can’t ignore other candidates, the question isn’t exactly answerable without more information, but Jonathan Marshall has a nice app with results for one set of assumptions. Approximately, instead of the margin of error for the difference being (2*square root (1/N)) as in the simple case, you replace the 1 by the sum of the two candidate estimates, so  (2*square root (0.35+0.30)/N).  The margin of error is about 7%.  If the support for the two candidates were equal, there would be about a 9% chance of seeing candidate 1 ahead of candidate 2 by at least 5%.

All this, though, doesn’t get you an answer to the question as originally posed.

If you poll 500 people, and candidate 1 is on 35% and candidate 2 is on 30%, what is the chance candidate 2 is really ahead?

This depends on what you knew in advance. If you had been reasonably confident that candidate 1 was behind candidate 2 in support you would be justified in believing that candidate 1 had been lucky, and assigning a relatively high probability that candidate 2 is really ahead. If you’d thought it was basically impossible for candidate 2 to even be close to candidate 1, you probably need to sit down quietly and re-evaluate your beliefs and the evidence they were based on.

The question is obviously looking for an answer in the setting where you don’t know anything else. In the general case this turns out to be, depending on your philosophy, either difficult to agree on or intrinsically meaningless.  In special cases, we may be able to agree.

If

  1. for values within the margin of error, you had no strong belief that any value was more likely than any other
  2. there aren’t values outside the margin of error that you thought were much more likely than those inside

we can roughly approximate your prior beliefs by a flat distribution, and your posterior beliefs by a Normal distribution with mean at the observed data value and with standard error equal to the margin of error.

In that case, the probability of candidate 2 being ahead is 9%, the same answer as the reverse question.  You could make a case that this was a reasonable way to report the result, at least if there weren’t any other polls and if the model was explicitly or implicitly agreed. When there are other polls, though, this becomes a less convincing argument.

TL;DR: The probability Winston is behind given that he polls 5% higher isn’t conceptually the same as the probability that he polls 5% higher given that he is behind.  But, if we pretend to be in exactly the right state of quasi-ignorance, they come out to be the same number, and it’s roughly 1 in 10.
March 12, 2015

Election donation maps

There are probably some StatChat readers who don’t read the NZ Herald, so I’ll point out that I have a post on the data blog about election donations.

March 5, 2015

Showing us the money

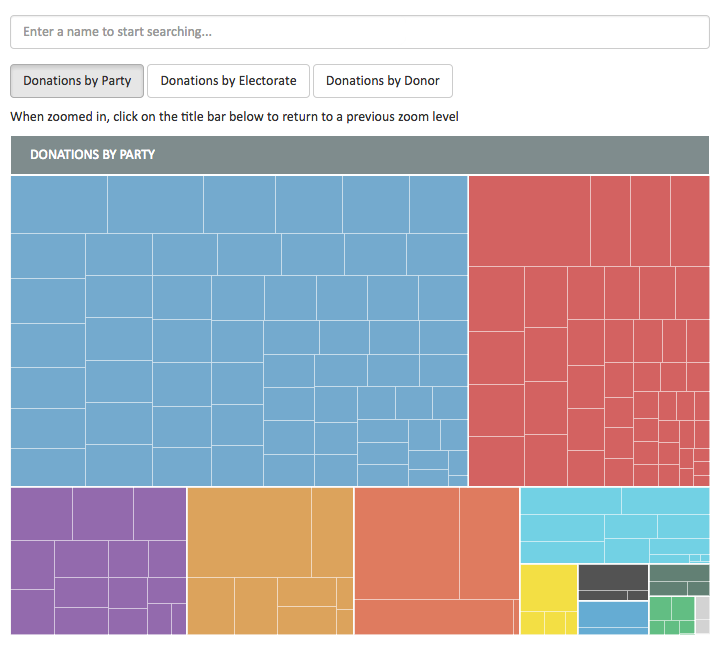
The Herald is running a project to crowdsource data entry and annotation for NZ political donations and expenses: it’s something that’s hard to automate and where local knowledge is useful. Today, they have an interactive graph for 2014 election donations and have made the data available

money

February 19, 2015

West Island census under threat?

From the Sydney Morning Herald

Asked directly whether the 2016 census would go ahead as planned on August 9, a spokeswoman for the parliamentary secretary to the treasurer Kelly O’Dwyer read from a prepared statement.

It said: “The government and the Bureau of Statistics are consulting with a wide range of stakeholders about the best methods to deliver high quality, accurate and timely information on the social and economic condition of Australian households.”

Asked whether that was an answer to the question: “Will the census go ahead next year?” the spokeswoman replied that it was.

Unlike Canada, it’s suggested they would at least save money in the short term. It’s the longer-term consequences of reduced information quality that are a concern — not just directly for Census questions, but for all surveys that use Census data to compensate for sampling bias. How bad this would be depends on what is used to replace the Census: if it’s a reasonably large mandatory-response survey (as in the USA), it could work well. If it’s primarily administrative data, probably not so much.

In New Zealand, the current view is that we do still need a census.

Key findings are that existing administrative data sources cannot at present act as a replacement for the current census, but that early results have been sufficiently promising that it is worth continuing investigations.


January 24, 2015

Measuring what you care about

Via Felix Salmon, here’s a chart from Credit Suisse that’s been making the headlines recently, in the Oxfam report on global wealth.  The chart shows where in the world people live for each of the ‘wealth’ deciles, and I’ve circled the most interesting piece.

wealth

About 10% of the least wealthy people in the world live in North America. This isn’t (just) Mexico, Guatemala, Nicaragua, etc, it’s also the US, because some people in the US have really big debts.

If you are genuinely poor, you can’t have hundreds of thousands of dollars of negative wealth because no-one would give you that sort of money. Compared to a US law-school graduate with student loans, you’re wealthy.  This is obviously a dumb way to define wealth. Also, as I’ve argued on the ‘net tax’ issue, cumulative percentages just don’t work usefully as summaries when some of the numbers are negative.

This doesn’t mean wealth inequality doesn’t exist (boy, does it) or doesn’t matter, but it does mean summaries like the Credit Suisse one don’t capture it. If you wanted to capture the sort of wealth inequality worth worrying about, you’d need to think about what it really meant and why it was a problem separately from income inequality (which is much easier to define).

There seem to be two concerns with wealth inequality that people on a reasonably broad political spectrum might care about, if we stipulate that redistributive international taxation is not on the agenda:

  • transfer of wealth from parents to children leads to social stratification
  • high concentrations of wealth give some people too much power (and more so in societies more corrupt than NZ).

Both of these are non-linear ($200 isn’t twice as much as $100 in any meaningful sense) and they both depend on where you are ($20,000 will get you much further in Nigeria than in Rhode Island). There probably isn’t going to be a good way to look at global wealth inequality. Within countries, it’s probably feasible but it will still take some care and I expect it will be necessary to discount debts quite a lot.  If you owe the bank $10, you’re not wealthy, but if you owe the bank $10 million, you probably are.