Posts filed under Politics (193)

September 8, 2015

Petitions and other non-representative data

Stuff has a story about the #redpeak  flag campaign, including a clicky bogus poll that currently shows nearly 11000 votes in support of the flag candidate. While Red Peak isn’t my favourite (I prefer Sven Baker’s Huihui),  I like it better than the four official candidates. That doesn’t mean I like the bogus poll.

As I’ve written before, a self-selected poll is like a petition; it shows that at least the people who took part had the views they had. The web polls don’t really even show that — it’s pretty easy to vote two or three times. There’s also no check that the votes are from New Zealand — mine wasn’t, though most of them probably are.  The Stuff clicky poll doesn’t even show that 11,000 people voted for the Red Peak flag.

So far, this Stuff poll at least hasn’t been treated as news. However, the previous one has.  At the bottom of one of the #redpeak stories you can read

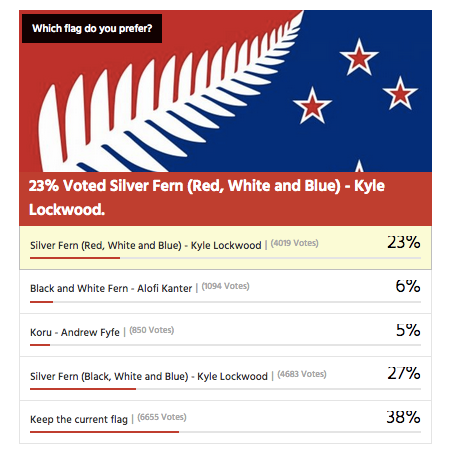
In a Stuff.co.nz poll of 16,890 readers, 39 per cent of readers voted to keep the current flag rather than change it. 

Kyle Lockwood’s Silver Fern (black, white and blue) was the most popular alternate flag design, with 27 per cent of the vote, while his other design, Silver Fern (red, white and blue), got 23 per cent. This meant, if Lockwood fans rallied around one of his flags, they could vote one in.

Flags designed by Alofi Kanter – the black and white fern – and Andrew Fyfe each got 6 per cent or less of the vote

They don’t say, but that looks very much like this clicky poll from an earlier Stuff flag story, though it’s now up to about 17500 votes

flagpoll

You can’t use results from clicky polls as population estimates, whether for readers or the electorate as a whole. It doesn’t work.

Over approximately the same time period there was a real survey by UMR (PDF), which found only 52% of people preferred their favourite among the four flags to the current flag.  The referendum looks a lot closer than the clicky poll suggests.

The two Lockwood ferns were robustly the most popular flags in the survey, coming  in as the top two for all age groups; men and women; Māori; and Labour, National and Green voters. Red Peak was one of the four least preferred in every one of these groups.

Only 1.5% of respondents listed Red Peak among their top four.  Over the whole electorate that’s still about 45000, which is why an online petition with 31000 electronic signatures should have about the impact it’s going to have on the government.

Depending on turnout, it’s going to take in the neighbourhood of a million supporting votes for a new flag to overturn the current flag. It’s going to take about the same number of votes ranking Red Peak higher than the Lockwood ferns for it to get on to the final ballot.

In the Stuff story, Graeme Edgeler suggests “Perhaps if there were a million people in a march” would be enough to change the government’s mind. He’s probably right, though I’d say a million estimated from a proper survey, or maybe fifty thousand in a march should be enough. For an internet petition, perhaps two hundred thousand might be a persuasive number, if there was some care taken that they were distinct people and eligible voters.

For those of us in a minority on flag matters, Andrew Geddis has a useful take

In fact, I’m pretty take-it-or-leave-it on the whole point of having a “national” flag. Sure, we need something to put up on public buildings and hoist a few times at sporting events. But I quite like the fact that we’ve got a bunch of other generally used national symbols that can be appropriated for different purposes. The silver fern for putting onto backpacks in Europe. The Kiwi for our armed forces and “Buy NZ Made” logos. The Koru for when we’re feeling the need to be all bi-cultural.

If you like Red Peak, fly it. At the moment, the available data suggest you’re in as much of minority as me.

September 7, 2015

Some refugee numbers

First, the Gulf States. It has been widely reported that the Gulf States have taken zero refugees from Syria.  This is by definition: they are not signatories to the relevant UN Conventions, so people fleeing to the Gulf States do not count as refugees according to the UNHCR. Those people still exist. There are relevant questions about why these states aren’t signatories, and about how they have treated the (many) Syrians who fled there,  and about whether they should accept more people from Syria, and about their humanitarian record in general. The official figure of zero refugees isn’t a good starting point, though.


Second, New Zealand. The Government has announced an increase in the refugee quota, but the announcement is a mixture of annual figures and figures added up across two and a half years. It would be clearer if the numbers used the same time period.

The current quota is 750 per year. Over the next 2.5 years that would be 1875 people. We are increasing this by 600, to 2475.  The current budget is $58 million/year. Over the next 2.5 years that would be $145 million. We are increasing this by an estimated $48 million, to $193 million. Either by numbers or by dollars, this is about a 1/3 increase.

August 31, 2015

Gender gap

As I’ve noted in the past, one of the big components of the remaining gender pay gap is lower pay for jobs that attract more women. I thought this was an issue where direct action would be infeasible. Maybe not.

Two New Zealand groups are now trying to target this, as described by Kirsty Johnson and Nicholas Jones in the Herald. When trying legal action, midwives and education support workers have the advantage that their wages are set by the government.

Having set wages for a large group gives the case someone to target, and it also weakens the counterargument based on individual differences. I don’t know whether this sort of claim is likely to succeed under NZ law, or what the impact would be if it did. I don’t even known whether success is desirable. But it’s an interesting approach to a real problem.

August 17, 2015

More diversity pie-charts

These ones are from the Seattle Times, since that’s where I was last week.

IMAG0103

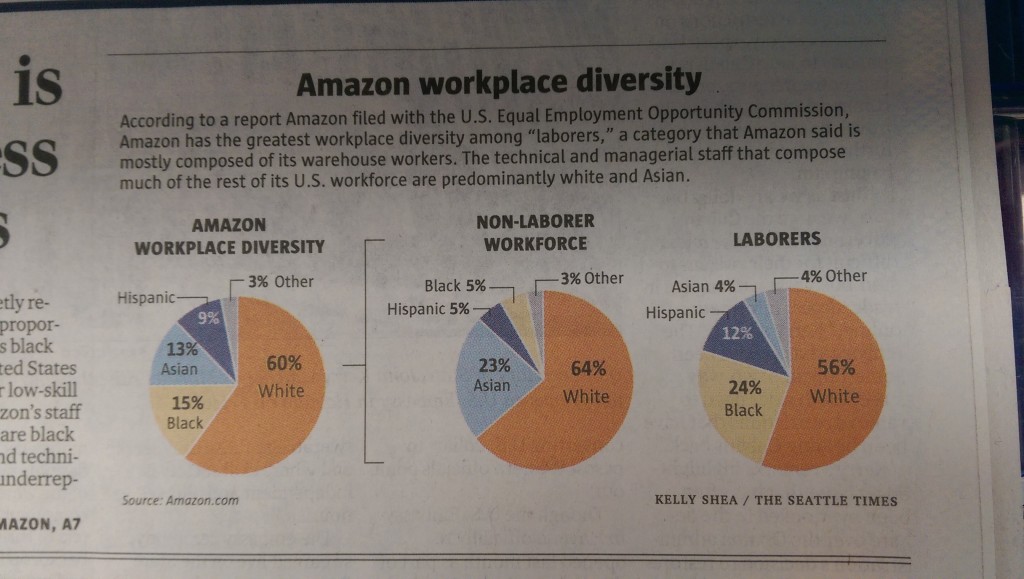
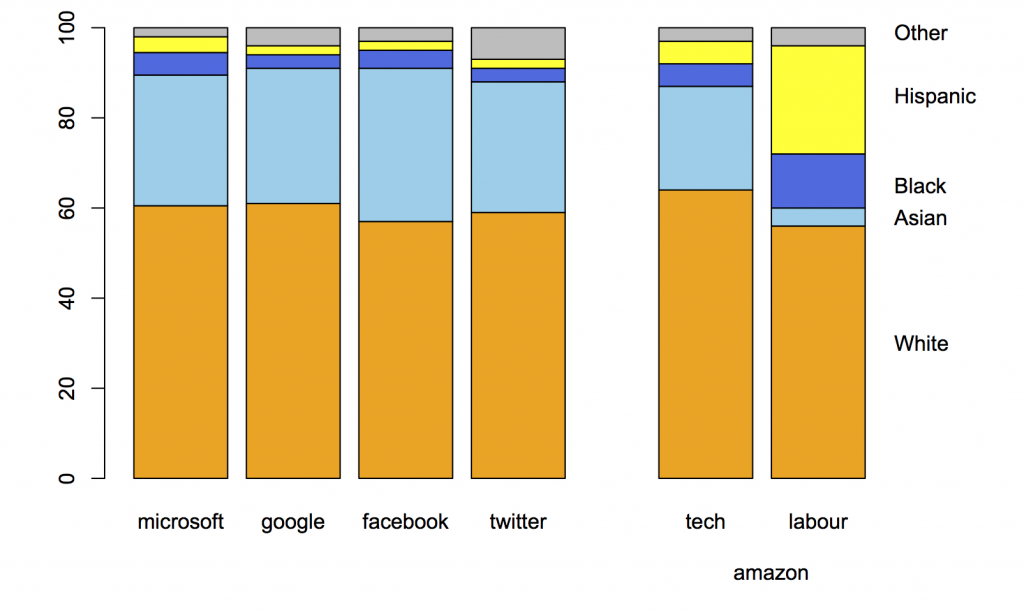
Amazon.com, like many other tech companies, had been persuaded to release figures on gender and ethnicity for its employees. On the original figures, Amazon looked  different from the other companies, but Amazon is unusual in being a shipping-things-around company as well as a tech company. Recently, they released separate figures for the ‘labourers and helpers’ vs the technical and managerial staff.  The pie chart shows how the breakdown makes a difference.

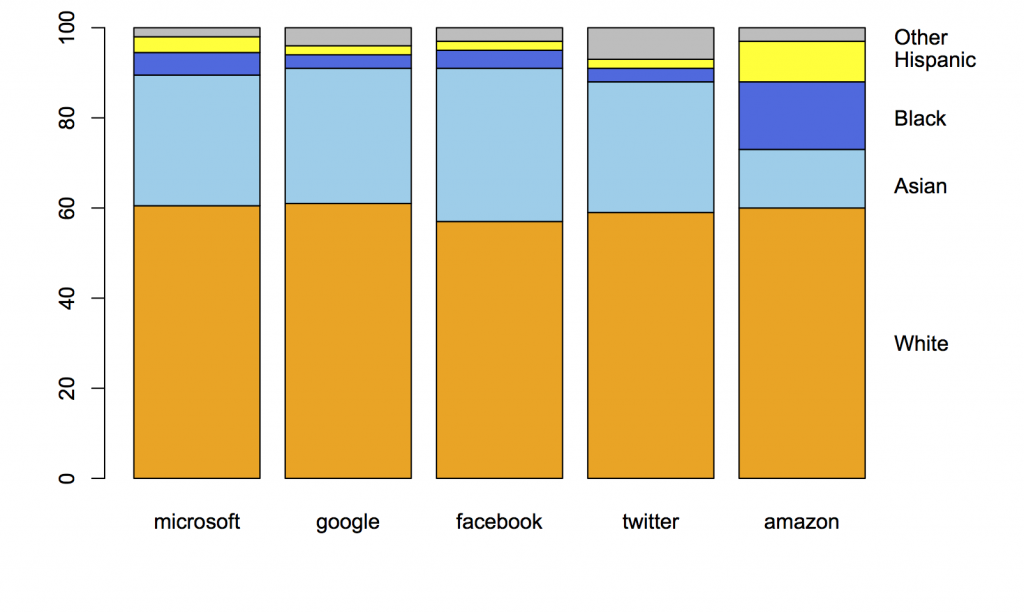
In contrast to Kirsty Johnson’s pie charts last week, where subtlety would have been wasted  given the data and the point she was making, here I think it’s more useful to have the context of the other companies and something that’s better numerically than a pie chart.

This is what the original figures looked like:

amazon-1

Here’s the same thing with the breakdown of Amazon employees into two groups:

amazon-2

When you compare the tech-company half of Amazon to other large tech companies, it blends in smoothly.

As a final point, “diversity” is really the wrong word here. The racial/ethnic diversity of the tech companies is pretty close to that of the US labour force, if you measure in any of the standard ways used in ecology or data mining, such as entropy or Simpson’s index.   The issue isn’t diversity but equal opportunity; the campaigners, led by Jesse Jackson, are clear on this point, but the tech companies and often the media prefer to talk about diversity.


August 5, 2015

What’s in a browser language default?

Ok, so this is from Saturday and I hadn’t seen it until this morning, so perhaps it should just be left in obscurity, but:

Claims foreign buyers are increasingly snapping up Auckland houses have been further debunked, with data indicating only a fraction of visitors to a popular real estate website are Asian.

Figures released by website realestate.co.nz reveal about five per cent of all online traffic viewing Auckland property between January and April were primary speakers of an East Asian language.

Of that five per cent, only 2.8 per cent originated from outside New Zealand meaning almost half were viewing from within the country.

The problem with Labour’s analysis was that it conflated “Chinese ethnicity” and “foreign”, but at least everyone on the list had actually bought a house in Auckland, and they captured about half the purchases over a defined time period. It couldn’t say much about “foreign”, but it was at least fairly reliable on “Chinese ethnicity” and “real-estate buyer”.

This new “debunking” uses data from a real-estate website. There is no information given either about what fraction of house buyers in Auckland used the website, or about what fraction of people who used the website ended up buying a house rather than just browsing, (or about how many people have their browser’s language preferences set up correctly, since that’s what was actually measured).  Even if realestate.co.nz captured the majority of NZ real-estate buyers, it would hardly be surprising if overseas investors who primarily prefer to use non-English websites used something different.  What’s worse, if you read carefully, is they say “online traffic”: these aren’t even counts of actual people.

So far, the follow-up data sets have been even worse than Labour’s original effort. Learning more would require knowing actual residence for actual buyers of actual Auckland houses: either a large fraction over some time period or a representative sample.  Otherwise, if you have a dataset lying around that could be analysed to say something vaguely connected to the number of overseas Chinese real-estate buyers in Auckland, you might consider keeping it to yourself.

August 1, 2015

NZ electoral demographics

Two more visualisations:

Kieran Healy has graphs of the male:female ratio by age for each electorate. Here are the four with the highest female proportion,  rather dramatically starting in the late teen years.

healy-electorates


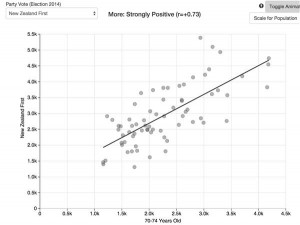
Andrew Chen has a lovely interactive scatterplot of vote for each party against demographic characteristics. For example (via Harkanwal Singh),  number of votes for NZ First vs median age

CLSSKS8UMAETS7_


July 15, 2015

Bogus poll story, again

From the Herald

[Juwai.com] has surveyed its users and found 36 per cent of people spoken to bought property in New Zealand for investment.

34 per cent bought for immigration, 18 per cent for education and 7 per cent lifestyle – a total of 59 per cent.

There’s no methodology listed, and this is really unlikely to be anything other than a convenience sample, not representative even of users of this one particular website.

As a summary of foreign real-estate investment in Auckland, these numbers are more bogus than the original leak, though at least without the toxic rhetoric.

July 11, 2015

What’s in a name?

The Herald was, unsurprisingly, unable to resist the temptation of leaked data on house purchases in Auckland.  The basic points are:

  • Data on the names of buyers for one agency, representing 45% fo the market, for three months
  • Based on the names, an estimate that nearly 40% of the buyers were of Chinese ethnicity
  • This is more than the proportion of people of Chinese ethnicity in Auckland
  • Oh Noes! Foreign speculators! (or Oh Noes! Foreign investors!)

So, how much of this is supported by the various data?

First, the surnames.  This should be accurate for overall proportions of Chinese vs non-Chinese ethnicity if it was done carefully. The vast majority of people called, say, “Smith” will not be Chinese; the vast majority of people called, say, “Xu” will be Chinese; people called “Lee” will split in some fairly predictable proportion.  The same is probably true for, say, South Asian names, but Māori vs non-Māori would be less reliable.

So, we have fairly good evidence that people of Chinese ancestry are over-represented as buyers from this particular agency, compared to the Auckland population.

Second: the representativeness of the agency. It would not be at all surprising if migrants, especially those whose first language isn’t English, used real estate agents more than people born in NZ. It also wouldn’t be surprising if they were more likely to use some agencies than others. However, the claim is that these data represent 45% of home sales. If that’s true, people with Chinese names are over-represented compared to the Auckland population no matter how unrepresentative this agency is. Even if every Chinese buyer used this agency, the proportion among all buyers would still be more than 20%.

So, there is fairly good evidence that people of Chinese ethnicity are buying houses in Auckland at a higher rate than their proportion of the population.

The Labour claim extends this by saying that many of the buyers must be foreign. The data say nothing one way or the other about this, and it’s not obvious that it’s true. More precisely, since the existence of foreign investors is not really in doubt, it’s not obvious how far it’s true. The simple numbers don’t imply much, because relatively few people are housing buyers: for example, house buyers named “Wang” in the data set are less than 4% of Auckland residents named “Wang.” There are at least three other competing explanations, and probably more.

First, recent migrants are more likely to buy houses. I bought a house three years ago. I hadn’t previously bought one in Auckland. I bought it because I had moved to Auckland and I wanted somewhere to live. Consistent with this explanation, people with Korean and Indian names, while not over-represented to the same extent are also more likely to be buying than selling houses, by about the same ratio as Chinese.

Second, it could be that (some subset of) Chinese New Zealanders prefer real estate as an investment to, say, stocks (to an even greater extent than Aucklanders in general).  Third, it could easily be that (some subset of) Chinese New Zealanders have a higher savings rate than other New Zealanders, and so have more money to invest in houses.

Personally, I’d guess that all these explanations are true: that Chinese New Zealanders (on average) buy both homes and investment properties more than other New Zealanders, and that there are foreign property investors of Chinese ethnicity. But that’s a guess: these data don’t tell us — as the Herald explicitly points out.

One of the repeated points I  make on StatsChat is that you need to distinguish between what you measured and what you wanted to measure.  Using ‘Chinese’ as a surrogate for ‘foreign’ will capture many New Zealanders and miss out on many foreigners.

The misclassifications aren’t just unavoidable bad luck, either. If you have a measure of ‘foreign real estate ownership’ that includes my next-door neighbours and excludes James Cameron, you’re doing it wrong, and in a way that has a long and reprehensible political history.

But on top of that, if there is substantial foreign investment and if it is driving up prices, that’s only because of the artificial restrictions on the supply of Auckland houses. If Auckland could get its consent and zoning right, so that more money meant more homes, foreign investment wouldn’t be a problem for people trying to find somewhere to live. That’s a real problem, and it’s one that lies within the power of governments to solve.

June 23, 2015

Refugee numbers

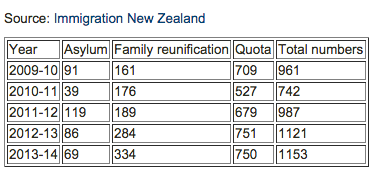
Brent Edwards on Radio NZ’s Checkpoint has done a good job of fact-checking claims about refugee numbers in New Zealand.  Amnesty NZ tweeted this summary table

CIJSRW9UMAABRkB

If you want the original sources for the numbers, the Immigration Department Refugee Statistics page is here (and Google finds it easily).

The ‘Asylum’ numbers are in the Refugee and Protection Status Statistics Pack, the “Approved” column of the first table. The ‘Family reunification’ numbers are in the Refugee Family Support Category Statistics Pack in the ‘Residence Visas Granted’ section of the first table. The ‘Quota’ numbers are in the Refugee Quota Settlement Statistics Pack, in the right-hand margin of the first table.

Update: @DoingOurBitNZ pointed me to the appeals process, which admits about 50 more refugees per year: 53 in 2013/4; 57 in 2012/3; 63 in 2011/2; 27 in 2010/11.


May 22, 2015

Budget viz

Aaron Schiff has collected visualisations of the overall NZ 2015 budget

A useful one that no-one’s done yet would be something showing how the $25 benefit increase works out with other benefits being considered as income — either in terms of the distribution of net benefit increases or in terms of effective marginal tax rate.