Posts filed under Politics (194)

November 21, 2012

Not so much poor and huddled masses

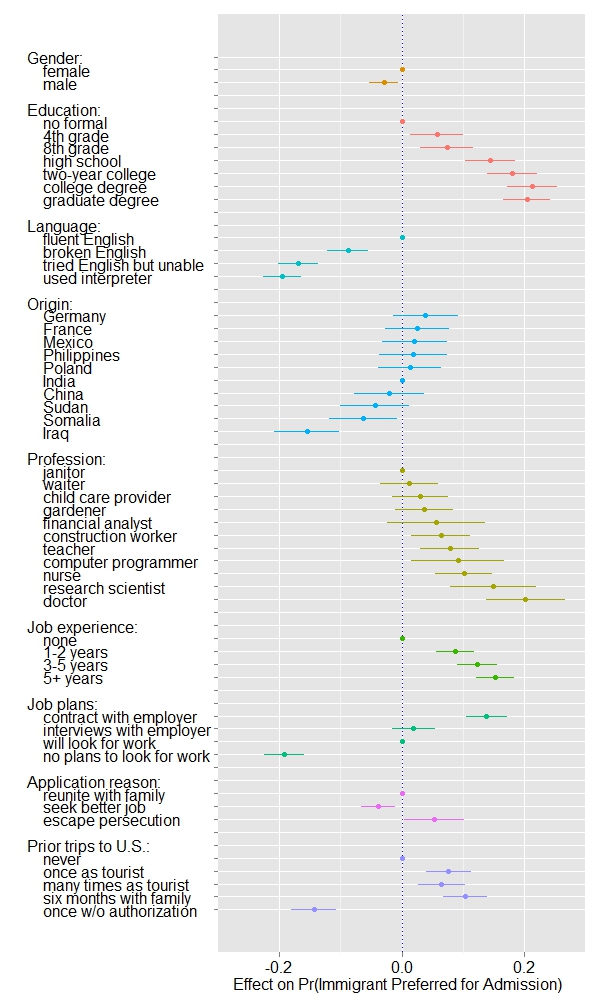
Nice presentation of interesting results on US opinions of immigration.  Participants were given two hypothetical immigrants with characteristics chosen from these options, and asked which one they would prefer to admit, and regression models were then used to estimate the impact of each characteristic.   Country of origin had a surprisingly small impact; otherwise it was pretty much what you might expect.  The story has more details, including a comparison by political affiliation, which reveals almost no disagreement.

While on the topic, you should read Eric Crampton’s proposal that anyone completing a (sufficiently real) degree in NZ should be eligible for permanent residence: not only boosting our education export industry, but attracting young, ambitious, educated immigrants. I think it’s a good idea, but I’m obviously biased.

November 19, 2012

Laboratories of democracy

The US states are often referred to as ‘laboratories of democracy’, suggesting that a typical American view of labs may be like this or this.

Back before the US election I posted a picture of the creatively-drawn electoral districts in Pennsylvania.  Redistricting is very effective: the Republicans got less than 50% of the total vote for Pennsylvania’s Representatives, but 70% of the seats.  The Democrats do the same things — they got 80% of Maryland’s seats with about 60% of the vote — but the Republicans controlled more states in the critical census year, and so managed to get a majority in the House of Representatives with a minority of the vote.

Here are graphs, from Mother Jones magazine. Remember that the moderate right-wing party in the US uses the same colour, blue, as here in NZ, and the red is for Republicans.


November 14, 2012

How good were US election predictions?

Neil Sinhababu has compiled a list of US election predictions by professional pundits, ranked on how well they predicted the overall Electoral College results, the ten marginal states, and the popular vote (as a tie-breaker).

Remember that since people such as Sam Wang, Simon Jackman, and Nate Silver obtain their predictions deterministically from poll data, and publish them in fine detail, people who have any additional sources of information not represented in opinion polls should be able to do better on average, since they can also use the poll summaries as inputs to their own thinking. On the whole, though, the people with additional sources of information mostly did worse.  If we say that Florida was too close to call, we find ten predictions that were otherwise accurate. One was the Intrade betting market, seven were deterministic models, and only two were individuals.

In the future, as happened with baseball after Moneyball, the journalists should start to use the statistical predictions more effectively.  They probably won’t beat the models by much, but they should be able to avoiding doing much worse and sometimes do slightly better.


November 8, 2012

Journalism and data analysis

The occasion is Nate Silver and the data-based predictions of the US election, but Mark Coddington raises a much more general point about the difference between ways of knowing things in journalism and science.

The journalistic norm of objectivity is more than just a careful neutrality or attempt to appear unbiased; for journalists, it’s the grounds on which they claim the authority to describe reality to us. And the authority of objectivity is rooted in a particular process.

But science finds things out differently, so journalists and scientists have difficulty communicating with each other.  In political journalism, the journalist gets access to insider information from multiple sources, cross-checks it, evaluates it for reliability, and tells us things we didn’t know.  In data-based journalism there aren’t inside secrets. Anyone could put together these information sources, and quite a few people did.  It doesn’t take any of the skills and judgment that journalists learn; it takes different skills and different sorts of judgment.

TL;DR: Political journalists are skeptical of Nate Silver because they don’t understand and don’t trust the means by which he knows what he knows. And they don’t understand it because it’s completely different from journalists have always known things, and how they’ve claimed authority to declare those things to the public.


October 6, 2012

Statistics conspiracy theories

This week, the  US Bureau of Labor Statistics issued a new jobs estimate that was more favorable than the previous one: good economic news, for a change.

Since the US is in an election campaign (as it is about half the time), a few conspiracy theorists came up with the idea that the new jobs weren’t real, but were part of a plot to re-elect the President.  The theory comes in two flavours: either that unemployed Democrats all over the country lied about having part time jobs in order to improve Obama’s position, or that the Bureau of Labor Statistics faked the numbers.

The idea that millions of people have just now, for the first time, decided simultaneously to pretend to have jobs collapses under its own weight. The idea of an official statistics conspiracy makes sense only if you don’t know anything about the Bureau of Labor Statistics.

Well-run official statistics agencies, such as the US and Canadian ones (and Stats NZ) are set up to make it hard for the current government to fudge the figures.  Even for something much less important than the employment figures, attempts by the White House to change the results would, at the minimum, result in senior public servants deciding to spend more time with their families or explore exciting new employment opportunities outside the government sector.  (see, for example, the Canadian census debacle)

The employment figures are guarded much more carefully, because of their impacts on politics, economics, and the financial markets.  If the Democrats, who are already ahead in the polls,  were going to risk a scandal that would dwarf Watergate, they’d want to get more out of it than three tenths of a percentage point in the unemployment rate, about 1.5 times the margin of error.


October 5, 2012

What happened when MPs took a maths exam

This just in from the BBC:

Could it be that Labour leader Ed Miliband’s demand that all school pupils must study maths until they are 18 has been prompted by new evidence that his own MPs struggle with numbers?

The man in charge of the party’s policy review, Jon Cruddas, admitted this weekend that he is “barely numerate”. And when the Royal Statistical Society (RSS) recently tested the ability of honourable members to answer a relatively simple mathematical question, only a quarter of Labour MPs got it right.

Read the rest of the yarn here.

October 1, 2012

Let’s-all-panic colour scheme

The excellent blog Freedom to Tinker, which focuses on political and social policy concerns related to computing, has an interactive graphic showing where problems with electronic voting are most likely to have a serious impact on the US election. Here’s a snapshot:


The ‘risk’ is scaled so that the top state, Ohio, is at 100. Because of the association of 100 with 100% that probably tends to exaggerate the impact, but the color scheme is worse. There’s almost no visible difference between Ohio at 100 and Virginia at 77, but Pennsylvania (47) is visibly paler than Nevada (57).  For comparison with the colour scale in the map, here’s a colour scale that tries to be uniform (a straight line in CIE Lab space)

Looking at this scale (and using a color picker program for better matching), Virginia seems to be at about 85, and Florida(61) well above 70.  So there really is a distortion of the visual impression.  The distortion probably isn’t deliberate, but comes from using linear interpolation on a scale that doesn’t match visual perception as well.

September 20, 2012

Precise questions and the 47%

Brad DeLong points out (mixed in with lots of other stuff) out how carefully you have to state things to get to the famous 47% of non-taxpaying Americans: Last year 47% of tax units paid no net federal income taxes. 

  • Last year: when unemployment was at record levels since the Great Depression
  • tax units: married couples filing jointly count as only one tax unit, so you undercount them relative to single people, who are more likely to be either young or old and thus lower-income
  • net: the USA delivers child benefits and some income support via the federal income tax system. A family whose child benefits are larger than their federal income tax is counted in the 47%
  • federal income taxes: it doesn’t include sales tax, state and local income taxes, or even federal payroll tax (which is paid as a proportion of income and funds Social Security and Medicare)

Precise questions can matter a lot.

September 13, 2012

Giving people money costs money

I’m glad to see that the cost estimates for beneficiaries released yesterday have become boring  and aren’t featured news (at least on the online media sites, I haven’t checked the squashed-tree versions).  If you’re planning to spend money getting people off benefits, it’s only financially worth doing so if you don’t spend a lot more than their benefits would have cost, so you need some idea of what that is.

I had looked briefly at a similar estimate of the cost of Parliament members. It works about to about $1 million each per year: if you add up the parts of budget Votes for the Parliamentary Counsel, Parliamentary Service, and Prime Minister and Cabinet that aren’t capital expenditure (and take off the cost of printing and distributing Parliament documents to the public) and divide by the number of MPs. To get a lifetime cost you’d need data on the distribution of time in office, which looked like it would take more than ten minutes to come up with.

We need a Parliament, and we need support for people who can’t support themselves.  Aggregate costs are a useful input to calculations, but as isolated headlines they’re not helpful.  They fail to address the basic question about any number: compared to what?

More surveys and political identity

Republicans and Democrats are hearing very different news about the economy:

In this example there are more possible explanations than last time:

  • They really are hearing different news, because local conditions vary.  This one can’t really be true, because the geographical polarisation of voters isn’t strong enough
  • They really are hearing different news, because they get it from different sources. In some ways that’s the most worrying possibility — a massive breakdown in the effectiveness of journalism.
  • They are hearing the same news, but it has different implications.  For example, perhaps Republicans think the prospect of higher tax rates on income above $250,000 is bad economic news and Democrats think it is good economic news.  I don’t think this can explain such a big and recent difference.
  • They are exposed to the same news, but only really hear the bits that confirm their beliefs.  Quite likely, and worrying.
  • They don’t really believe what they are saying. The most positive interpretation, except if you’re in the survey business.