Posts filed under Politics (194)

March 29, 2013

Unclear on the concept: average time to event

One of our current Stat of the Week nominations is a story on Stuff claiming that criminals sentenced to preventive detention are being freed after an average of ‘only’ 11 years.

There’s a widely-linked story in the Guardian claiming that the average time until Google kills new services is 1459 days, based on services that have been cancelled in the past.  The story even goes on to say that more recent services have been cancelled more quickly.

As far as I know, no-one has yet produced a headline saying that the average life expectancy  for people born in the 21st century is only about 5 years, but the error in reasoning would be the same.

In all three cases, we’re interested in the average time until some event happens, but our data are incomplete, because the event hasn’t happened for everyone.  Some Google services are still running; some preventive-detention cases are still in prison; some people born this century are still alive.  A little thought reveals that the events which have occurred are a biased sample: they are likely to be the earliest events.   The 21st century kids who will live to 90 are still alive; those who have already died are not representative.

In medical statistics, the proper handling of times to death, to recurrence, or to recovery is a routine problem.  It’s still not possible to learn as much as you’d like without assumptions that are often unreasonable. The most powerful assumption you can make is that the rate of events is constant over time, in which case the life expectancy is the total observed time divided by the total number of events — you need to count all the observed time, even for the events that haven’t happened yet.  That is, to estimate the survival time for Google services, you add up all the time that all the Google services have operated, and divide by the number that have been cancelled.  People in the cricket-playing world will recognise this as the computation used for batting averages: total number of runs scored, divided by total number of times out.

The simple estimator is often biased, since the risk of an event may increase or decrease with time.  A new Google service might be more at risk than an established one; a prisoner detained for many years might be less likely to be released than a more recent convict.  Even so, using it distinguishes people who have paid some attention to the survivors from those who haven’t.

I can’t be bothered chasing down the history of all the Google services, but if we add in search (from 1997),  Adwords (from 2000), image search (2001), news (2002),  Maps, Analytics, Scholar, Talk, and Transit (2005), and count Gmail only from when it became open to all in 2007, we increase the estimated life expectancy for a Google service from the 4 years quoted in the Guardian to about 6.5 years.  Adding in other still-live services can only increase this number.

For a serious question such as the distribution of time in preventive detention you would need to consider trends over time, and differences between criminals, and the simple constant-rate model would not be appropriate.  You’d need a bit more data, unless what you wanted was just a headline.
March 25, 2013

Intergenerational inequality

The United States has surprisingly low social mobility: in every country, the children of the rich are more likely to be rich than the children of the poor, but the US is even worse than most Western countries.

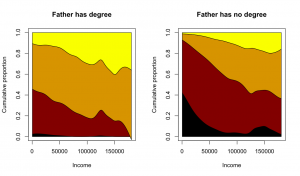
Felix Salmon links to some graphs by Evan Soltas, looking at mobility in terms of education, with data from the US General Social Survey. He finds that people whose fathers did not go to university are much less likely to go to university themselves (unsurprising), and that this is true at all levels of income (more interesting).

I’ve repeated what Soltas did, but smoothing[1] the relationships to remove the visual noise, and also restricting to people aged 25-40 (rather than 18+)

ineq


In each panel, black is less than high school, dark red is high school, light brown is university or junior college and yellow is postgraduate. These are plotted by family income (in inflation-adjusted US dollars).  The left panel is for people whose fathers had at least a junior college degree; the right is those whose fathers didn’t.

The difference is striking, and as Soltas says, may imply a greater long-term value for encouraging education than people had thought.


[1] For people who want the technical details:  A sampling-weighted local-linear smoother using a Gaussian kernel with bandwidth $10000, ie, svysmooth() in the R survey package. Bandwidth chosen using the ‘Goldilocks’ method[2]

[2] What? $3000 is too wiggly, $30000 is too smooth, $10000 is just right.

March 21, 2013

That’s not worth a thousand words

The Herald has an interesting set of displays of the latest DigiPoll political opinion survey.  According to the internets it was even worse earlier in the day, but we can pass over that and only point out that corrections in news stories shouldn’t happen silently (except perhaps for typos).

We can start with the standard complaint: the margin of error for the poll itself is 3.6%, so the margin of error for change since the last poll is 1.4 times higher, or a little over 5%. None of the changes is larger than 5%, and only one comes close.

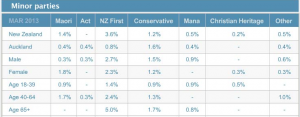
Secondly, there is a big table for the minor parties. I would normally not quote the whole table, but in this case it’s already changed once today.

minorparties


The total reported for the minor parties is 6.1%, and since there were 750 people sampled, 46 of them indicated support for one of these parties. That’s not really enough to split up over 7 parties. These 46 then get split up further, by age and gender. At this point, some of the sample proportions are zero, displayed as “-” for some reason.

[Updated to add: and why does the one male 40-64 yr old Aucklander who supported ACT not show up in the New Zealand total?]

Approximately 1 in 7 New Zealanders is 65+, so that should be about 6 or 7 minor-party supporters in the sample.  That’s really not enough to estimate a split over 7 parties. Actually, the poll appears to have been lucky in recruiting older folks: it looks like 6 NZ First, 2 Conservative, 1 Mana.

That’s all pretty standard overtabulating, but the interesting and creative problems happen at the bottom of the page.  There’s an interactive graph, done with the Tableau data exploration software.  From what I’ve heard, Tableau is really popular in business statistics: it gives a nice clear interface to selecting groups of cells for comparison, dropping dimensions, and other worthwhile data exploration activities, and helps analysts present this sort of thing to non-technical managers.

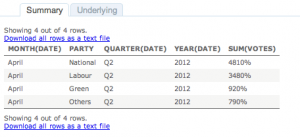
However, the setup that the Herald have used appears to be intended for counts or totals, not for proportions.  For example, if you click on April 2012, and select View Data, you get

tab


which is unlikely to improve anyone’s understanding of the poll.

I like interactive graphics.  I’ve put a lot of time and effort into making interactive graphics.  I’ve linked to a lot of good interactive graphics on this blog. The Herald has the opportunity to show the usefulness of interactive graphics to a much wider community that I’ll ever manage. But not this way.

March 17, 2013

Briefly

  • When data gets more important, there’s more incentive to fudge it.  From the Telegraph: ” senior NHS managers and hospital trusts will be held criminally liable if they manipulate figures on waiting times or death rates.”
  • A new registry for people with rare genetic diseases, emphasizing the ability to customise what information is revealed and to whom.
  • Wall St Journal piece on Big Data. Some concrete examples, not just the usual buzzwords
  • Interesting visualisations from RevDanCat
March 15, 2013

Policing the pollsters … your input sought

This is from Kiwiblog:

A group of New Zealand’s leading political pollsters, in consultation with other interested parties, have developed draft NZ Political Polling Guidelines.

The purpose is to ensure that Association of Market Research Organisations and Market Research Society of New Zealand members conducting political polls, and media organisations publishing poll results, adhere to the highest “NZ appropriate” standards. The guidelines are draft and comments, questions and recommendations back to the working group are welcome.

This code seeks to document best practice guidelines for the conducting and reporting of political polls in New Zealand. It is proposed that the guidelines, once approved and accepted, will be binding on companies that are members of  AMRO and on researchers that are members of MRSNZ.

March 12, 2013

Non-sampled poll reporting

As the Novopay debacle continues, Stuff and the Herald are both reporting a survey done of its members by the Post-Primary Teachers Association. At Stuff, the story begins:

Nearly 36 per cent of secondary school staff are not reporting their Novopay glitches, a survey has found, casting doubt on the Government’s claims of an improvement in the payroll system.

The Post Primary Teachers’ Association found that 38.2 per cent of staff were underpaid, overpaid or not paid at all during the February 20 pay cycle.

That compares with only 1.9 per cent of staff who logged problems with the system, as reported by Novopay Minister Steven Joyce using PricewaterhouseCoopers figures.

In the Herald:

Up to 1600 teachers did not report complaints through official channels over mistakes with their pay administered through the Novopay pay roll system, according to a union survey.

The Post Primary Teachers Association surveyed 4500 teachers for the pay period ending February 20 and found 36 per cent had not formally reported errors with their pay because they were either “too embarrassed” or feared putting school administrators under more pressure.

In this case the PPTA report is easily available (59 page PDF), so we can find out what was actually done.  The union surveyed all its (roughly 18000) members, using an online poll. They received 4659 responses from members, of whom 1712 were affected.

Obviously, teachers who had experienced problems would be more likely to respond, especially if the reason they hadn’t complained to the local administrators was because they didn’t want to put them under more pressure. The PPTA report handles this issue very well. On page 13 they give calculated Novopay error rates under the assumption that 100% of those with problems responded, and under the assumption that the responses are representative. This gives upper and lower bounds, and the lower bound is substantially higher than Novopay is claiming.

In the media stories, things are a bit confused.  The 36% or 38% are proportions assuming the responses were representative. The numbers in the vicinity of 1600 look like the number assuming that everyone adversely affected responds, perhaps minus an estimate of how many of them Novopay reported. I haven’t been able to reconcile them with the PPTA report.  In any case, neither paper accurately described how the data were collected, even though this was made clear by the PPTA.


March 6, 2013

Twitter is not a random sample

From Stuff,

If you’ve ever viewed Twitter as a gauge of public opinion, a weathervane marking the mood of the masses, you are very much mistaken.

That is the rather surprising finding of a new US study, which suggests the microblog zeitgeist differs markedly from mainstream public opinion.

Apart from being completely unsurprising, this is a useful thing to have data on.  The Pew Charitable Trusts, who do a lot of surveys, compared actual opinion polls to tweet summaries for some major political and social issues in the US, and found they didn’t agree.

Along the same lines, it was reported last month that Google’s Flu Trends overestimated the number of flu cases this year (after having initially underestimated the H1N1 pandemic), probably because the high level of publicity for the flu vaccine this year made people more aware.

These data summaries can be very useful, because they are much less expensive and give much more detail in space and time than traditional data collection, but they are also sensitive to changes in online behaviour. Getting anything accurate out of them requires calibration to ‘ground truth’, as a previous generation of Big Data systems called it.

March 5, 2013

They think they are representing you

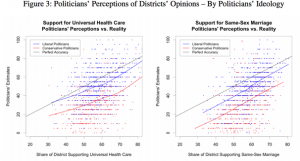
An interesting finding from the US (via):  politicians think their electorates are more conservative than they actually are — slightly more conservative for left-wing politicians, much more conservative for right-wing ones.

broockman_graph


The errors are large: right-wing politicians overestimate the support among their electorate for conservative positions by an average of nearly 20%.  The size of the error, and the big differences by ideology of the politician mean that it can’t just be explained by actual voters being more conservative than the population at large.

March 3, 2013

The data speak for themselves

Today, from the Herald “More people on benefits as Govt fiddles with job requirements”

Labour spokeswoman for social development Jacinda Ardern said the highest unemployment numbers were at around 10 per cent in the early 1990s but support for solo parents and invalids have hit record highs during Bennett’s reign as Social Development Minister.

Between January 2009 and January 2012, the number of people on the DPB rose by 13.2 per cent. During the same period, the number of people on the unemployment benefit rose by 82 per cent.

Late January, in the Fairfax papers, “Beneficiary numbers in overall down trend”

Staff at Work and Income work hard to identify job opportunities with local employers and connect them with people who’re ready to work,” Mrs Bennett said.

On average Winz put 1000 people into new jobs each week around the country.

In the year to October 2012, 82,000 New Zealanders went off benefits and into work.

Ministry of Social Development website figures show the number of people on the unemployment benefit last month was the lowest December figure since 2008.

Since the actual numbers are a matter of public record, presumably both Adern and Bennett are telling the literal truth, but both of them are being misleading. To start with, you’d have to be suspicious about a trend that’s being quoted up to Jan 2012, which was more than a year ago.

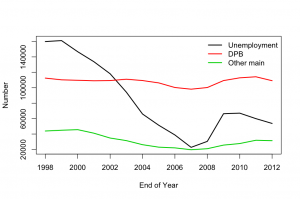
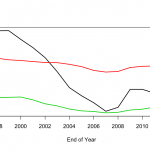
If you at the actual numbers, from the Ministry of Social Development (and work around the fact that they are in a Word document, not some sensible data format), it becomes clear that there are two patterns.  For unemployment, Dependent Persons Domestic Purposes, and “Other main” benefits, the main variation is with the state of the economy (strongly, for unemployment, more weakly for the other two).  It’s not really possible to tell if the recent changes have had any effect, but it is clear that anyone quoting a difference between two points as if it was evidence is not to be trusted.

benefits1


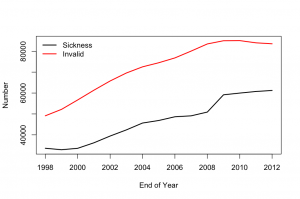
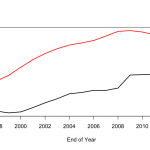
Sickness benefit and Invalid’s benefit have been rising, for as long as I can find the numbers, though the rise has flattened off in recent years.  This could possibly be evidence for the effectiveness of Bennett’s changes; it really can’t be evidence against them.

benefits2


Ideally these should have been standardised by population, which increased about 25% over this period, but it doesn’t make much difference, as you can see.  Age adjustment would also be useful, but is a lot more work.

benefits3  benefits4

February 28, 2013

Unclear on the concept

The whole point of the Alltrials.net campaign is to prevent selective publication of clinical trial results.  The problem is that drug companies (and everyone else) publish only about half of their trials and are more likely to publish results if they are positive, distorting the available evidence. The only fix is not to let them be selective.

Roche has responded to the campaign by saying it will set up a panel to approve requests for access to anonymised patient data.  That’s nice, and it will be helpful for certain types of research, but it completely misses the point of the AllTrials campaign.

As Tracey Brown, of the British organisation Sense about Science, comments: “Which bit of All and Trials do they not understand?”