Posts filed under Politics (194)

May 13, 2013

Your guess is as good as ours

There’s currently discussion in NZ about whether to change the 5-yearly census.  North America is providing some examples of what not to do.

Canada decided a while back that they were going to chop most of the questions off the census and put them in a new survey.  The new survey is still sent to everyone, but is voluntary — the worst of both worlds, since a much smaller survey would allow for more effort per respondent in follow-up. Frances Woolley compares the race/ethnicity data from the 2006 Census and the new survey: the survey is dramatically overcounting minorities.

In the USA, a Republican congressman has proposed a bill that would stop the Department of Commerce and the Census Bureau from collecting basically anything other than the census.  That would wipe out the American Community Survey, the detailed 1%/year sample that provides a wide range of regional data. It would also wipe out the Current Population Survey, used to estimate the unemployment rate.  Fortunately for the US economy, there’s no chance of this bill becoming law: the business community hates it, and Senate will never pass it.  It’s still worrying that there’s a public-opinion advantage in pretending you want to abolish the government’s economic data collection.
May 9, 2013

Counting signatures

A comment on the previous post about the asset-sales petition asked how the counting was done: the press release says

Upon receiving the petition the Office of the Clerk undertook a counting and sampling process. Once the signatures had been counted, a sample of signatures was taken using a methodology provided by the Government Statistician.

It’s a good question and I’d already thought of writing about it, so the commenter is getting a temporary reprieve from banishment for not providing a full name.  I don’t know for certain, and the details don’t seem to have been published, which is a pity — they would be interesting and educationally useful, and there doesn’t seem to be any need for confidentiality.

While I can’t be certain, I think it’s very likely that the Government Statistician provided the estimation methodology from Statistics New Zealand Working Paper No 10-04, which reviews and extends earlier research on petition counting.

There are several issues that need to be considered

  • removing signatures that don’t come with the required information
  • estimating the number of eligible vs ineligible signatures
  • estimating the number of duplicates
  • estimating the margin of error in the estimate
  • deciding what level of uncertainty is acceptable

The signatures without the required information are removed completely; that’s not based on sampling.  Estimating eligible vs ineligible signatures is fairly easy by checking a sufficiently-large random sample — in fact, they use a systematic sample, taking names at regular intervals through the petition list, which tends to give more precise results and to be more auditable.  

Estimating unique signatures is  tricky, because if you halve your sample size, you expect to see 1/4 as many duplicates, 1/8 as many triplicates, and so on. The key part of the working paper shows how to scale up the the sample data on eligible, ineligible, and duplicate, triplicate, etc, signatures to get the unique unbiased estimator of the number of valid signatures and its variance.

Once the level of uncertainty is specified, the formulas tell you what sample size to verify and what to do with the results.  I don’t know how the sample size is chosen, but it wouldn’t take a very large sample to get the uncertainty down to a few thousand, which would be good enough.   In fact, since the methodology is public and the parties have access to the electoral roll in electronic form, it’s a bit surprising that the petition organisers didn’t run a quick check themselves before submitting it.


May 7, 2013

Not adding up

As you know, the petition for a referendum over asset sales has not reached its goal yet, due to lots of invalid signatures. This is not a new problem — the petition over the anti-smacking law initially had 17% invalid signatures and also fell short of its threshold on the first round — but it does seem to be worse than usual.

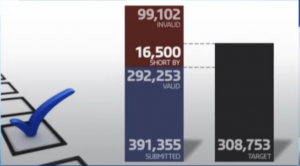
3News displayed this graph of the shortfall

petition shortfall


It seemed to me that the 16,500 bar was a bit wider that I’d expect, so I checked on the video from the website.  On my screen capture, which I think is what you get if you click on the image, the black bar has 872 signatures per pixel, the blue bar has 1018 signatures per pixel, the whole red bar has 535 signatures per pixel, and the 16500 shortfall has 232 signatures per pixel.  That is, the vertical scale for the shortfall is about four times that for the valid signatures.

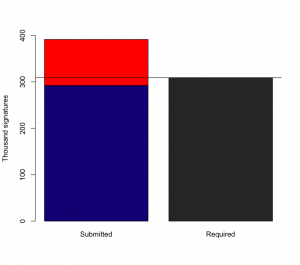
I’m really not accusing 3News of deliberately distorting the numbers — it looks to me as if the shortfall bar has been made the right height to contain its text, that the blue+red bars height is scaled to the available screen estate, and that the black bar is scaled to the total blue+red height .  But it’s a pity that the result is to amplify the visual size of the shortfall — and if the visual size weren’t important the graph would be a complete waste of time.

Scaled in proportion, the bars look like this

shortfall


May 6, 2013

Some surprising things

  • From Felix Salmon: US population is increasing, and people are moving to the cities, so why is (sufficiently fine-scale) population density going down? Because rich people take up more space and fight for stricter zoning.  You’ve heard of NIMBYs, but perhaps not of BANANAs
  • From the New York Times.  One of the big credit-rating companies is no longer using debts referred for collection as an indicator, as long as they end up paid.  This isn’t a new spark of moral feeling, it’s just for better prediction.
  • And from Felix Salmon again: Firstly, Americans are bad at statistics. When it comes to breast cancer, they massively overestimate the probability that early diagnosis and treatment will lead to a cure, while they also massively underestimate the probability that an undetected cancer will turn out to be harmless.
May 2, 2013

Why does no-one listen to us?

Dan Kahan, a researcher in the Cultural Cognition project at Yale Law School, has an interesting post on “the science communication problem”

The motivation behind this research has been to understand the science communication problem. The “science communication problem” (as I use this phrase) refers to the failure of valid, compelling, widely available science to quiet public controversy over risk and other policy relevant facts to which it directly speaks. The climate change debate is a conspicuous example, but there are many others

April 23, 2013

When ‘self-selected’ isn’t bogus

Two opportunities for public comment that will expire soon, and where StatsChat readers might have something to say

  • Stats New Zealand wants to hear from people who use Census data.  They have a questionnaire on how you use the data, and how this might be affected if they change the Census in various ways. It’s open until Friday May 3
  • Public submissions on the new ‘legal highs’ bill close on Wednesday May 1.  The bill is here. You can make a submission here.  The Drug Foundation have a description and recommendations here

This sort of public comment is qualitative, rather than quantitative.  Neither the Select Committee nor Stats New Zealand is likely to count up the number of submissions taking a particular view and use this as a population estimate, because that would be silly.  What they should be aiming for is a qualitatively exhaustive sample, one that includes all the arguments for or against the bill, or all the different ways people use Census data.

April 10, 2013

Another NZ blog

JustSpeak is

a non-partisan network of young people speaking to, and speaking up for a new generation of thinkers who want change in our criminal justice system.

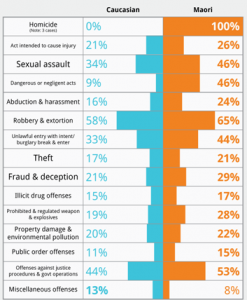
I’m linking because they have a good visualisation of the recently-released police crime statistics, comparing the proportion of apprehensions leading to prosecution among Maori and Pakeha youth. The back-to-back bar charts take advantage of the brain’s ability to detect lack of symmetry.

youfcrime

I probably would have left out the homicide category, which has too few to compare, and it would be interesting to see if small gaps between the categories help.

The real problem is in interpretation.  It’s hard to say what you’d expect just from economic differences and differences in where people live, without any differences in how they are treated by police. A higher proportion of prosecutions could mean the police are using their discretion to prosecute more Maori youth, but a lower proportion of prosecutions could just as easily have been interpreted as harassment of innocent Maori youth.


April 8, 2013

Explore your budget

Keith Ng’s annual NZ Budget visualization seems to be up. Go play.

You might also like last years’ one.  And possibly even the 2011 radioactive space donut.

All clinical trial results should be published

If you’re one of the 40,000 or so people who has signed the Alltrials petition you will have received an email from Ben Goldacre asking for more help.

The  Declaration of Helsinki, the major document on research ethics in medicine, already states

30. Authors, editors and publishers all have ethical obligations with regard to the publication of the results of research. Authors have a duty to make publicly available the results of their research on human subjects and are accountable for the completeness and accuracy of their reports. They should adhere to accepted guidelines for ethical reporting. Negative and inconclusive as well as positive results should be published or otherwise made publicly available. Sources of funding, institutional affiliations and conflicts of interest should be declared in the publication. Reports of research not in accordance with the principles of this Declaration should not be accepted for publication.

The petition is trying to get these principles enforced. Publication bias isn’t just a waste of the voluntary participation of (mostly sick) people in research. Publication bias means we don’t know which treatments really work.

In my first job (as a lowly minion) in medical statistics, my boss was Dr John Simes, an oncologist. Back in the 1980s he had shown that publication bias in cancer trials gave the false impression that a more toxic chemotherapy regimen for ovarian cancer had substantial survival benefits to weigh against the side-effects.  Looking at all registered (published and unpublished) trials showed the survival benefit was small and quite possibly non-existent.  The specific treatment regimens he studied have long been outmoded, but his message is still vitally important.

These examples illustrate an approach to reviewing the clinical trial literature, which is free from publication bias, and demonstrate the value and importance of an international registry of all clinical trials.

Nearly thirty years later, we are still missing information about the benefits and risks of drugs.

For example, influenza researchers have used detailed simulation models to assess control strategies for pandemic flu. These simulation models need data about the effectiveness of drugs and vaccines.  When the next flu pandemic hits, we really need these models to be accurate, so it’s especially disturbing that Tamiflu is one of the drugs with substantial unpublished clinical trial data.

April 3, 2013

Crime news vs crime data

If you actually look at the data, neither the Herald nor Stuff comes off well in today’s crime figure reports.  Stuff has the headline “Crime drop due to ‘tag and release'”, and it’s not until the third paragraph that they admit the ‘tag and release’ impact is on court workloads and has nothing to do with  number of crimes reported.  The Herald says

Crime is at its lowest level in 24 years but the percentage of offences that police solve is also dropping – less than half of all cases.

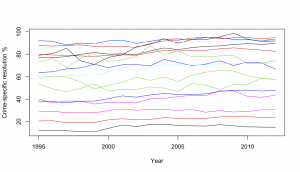
This is at least technically true, but the drop they are talking about is less than one percentage point, when the resolution rate differs between types of crime by about 90 percentage points. Even a small change in the relative numbers of different offenses would make a one percentage difference in overall resolution rate meaningless.  Here, using data from Stats New Zealand are the resolution rates for 16 categories of crime over the past 18 years.

crime-specific

I haven’t tried to label them all, but at the top are homicides, acts intended to cause injury, illegal drug offenses, and offenses against justice procedures and government operations.  The reasons vary:  the resolution rate for violent crimes is high because police put a lot of effort into solving them;  the rate is high for drug offenses because they aren’t usually reported except when the police discover them.  At the low end are burglary and unlawful entry, where the vast majority of cases are never resolved.  If anyone is trying to sell you a policy based on a small change in the average of these, without accounting for variation in proportions, you should keep a firm grip on your wallet.

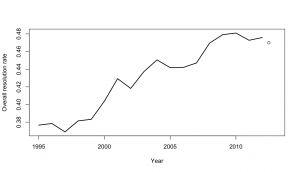
Against that background, what does the trend in resolution rate look like?

overall


The lines show the past 18 fiscal years, the dot shows todays data for the 2012 calendar year.  It’s possible that the resolution rate is flattening out at its peak of 48%, or even decreasing slowly over the past few years, but it’s hardly convincing evidence of a trend.


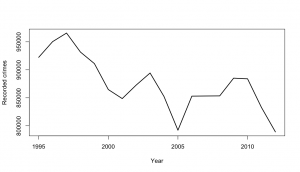
The change in recorded crimes over time is also a fairly noisy trend, but generally downwards even before we account for population growth

recorded


It’s also worth pointing out that preventing crime is important, but catching criminals is beneficial primarily as a means of preventing crime.  A low crime rate with few crimes resolved is far preferable to a high crime rate with most crimes resolved.   The easiest way for the police to increase the resolution rate would be to put more effort into catching drug users, but it would be hard to regard that as the most socially useful way to spend their time and taxpayers money.