Posts filed under Medical news (341)

January 28, 2015

Tracking medical results to their source

From the Herald

A study from the Garvan Institute in Australia demonstrates that a diet rich in coconut oil protects against ‘insulin resistance’ (an impaired ability of cells to respond to insulin) in muscle and fat and avoids the accumulation of body fat caused by other high fat diets.


Suppose we wanted to find this study and see what it really demonstrates. There’s not a  lot to go on, but the Google knows all and sees all. When you have more information — researcher names, journal names, words from the title of the paper — Google Scholar is the best bet (as Jeff Leek explains here).  With just “Garvan Institute coconut oil”, Google Scholar isn’t very helpful.

However, since this study is popular among coconut lobbyists, an ordinary Google search does quite well. For me, the top hit is a press release from the Garvan Institute. The press release begins

A new study in animals demonstrates that a diet rich in coconut oil protects against ‘insulin resistance’ (an impaired ability of cells to respond to insulin) in muscle and fat. The diet also avoids the accumulation of body fat caused by other high fat diets of similar calorie content. Together these findings are important because obesity and insulin resistance are major factors leading to the development of Type 2 diabetes.

I’ve highlighted two key phrases: this was an animal study, and the coconut oil diet did well compared to another high fat, high calorie diet.

What’s more, the Garvan press release links to the research paper. The abstract is open-access; here are two quotes from it

Mice fed the MCFA diet displayed reduced adiposity and better glucose tolerance than LCFA-fed animals.

In rats, isocaloric feeding of MCFA or LCFA HF diets induced hepatic insulin resistance to a similar degree, however insulin action was preserved at the level of LF controls in muscle and adipose from MCFA-fed animals.

That is, in mice, coconut oil was better than the same amount of lard (though not as good as a low-fat diet); in rats coconut oil was as bad as lard on one measure of insulin resistance, but was comparable to the low-fat diet on another measure.

If the results translated to humans, this would show a diet high in coconut oil was better for insulin resistance than one high in animal fat, but worse than a low-fat diet.
January 27, 2015

Benadryl and Alzheimers

I expected the Herald story “Hay fever pills linked to Alzheimer’s risk – study” to be the usual thing, where a fishing expedition found a marginal correlation in low-quality data.  It isn’t.

The first thing I noticed  when I found the original article is that I know several of the researchers. On the one hand that’s a potential for bias, on the other hand, I know they are both sensible and statistically knowledgeable. The study has good quality data: the participants are all in one of the Washington HMOs, and there is complete information on what gets prescribed for them and whether they fill the prescriptions.

One of the problems with drug:disease associations is confounding by indication. As Samuel Goldwyn observed, “Any man who goes to a psychiatrist needs to have his head examined”, and more generally the fact that medicine is given to sick people tends to make it look bad.  In this case, however, the common factor between the medications being studied is an undesirable side-effect for most of them, unrelated to the reason they are prescribed.  In addition to reducing depression or preventing allergic reactions, these drugs also block part of the effect of the neurotransmitter acetylcholine. The association remained just as strong when recent drug use was excluded, or when antidepressant drugs were excluded, so it probably isn’t that early symptoms of Alzheimer’s lead to treatment.

The association replicates results found previously, and is quite strong, about four times the standard error (“4σ”) or twice the ‘margin of error’. It’s not ridiculously large, but is enough to be potentially important: a relative rate of about 1.5.

It’s still entirely possible that the association is due to some other factor, but the possibility of a real effect isn’t completely negligible. Fortunately, many of the medications involved are largely obsolete: modern hayfever drugs (such as fexofenadine, ‘Telfast’) don’t have anticholinergic activities, and nor do the SSRI antidepressants. The exceptions are tricyclic antidepressants used for chronic pain (where it’s probably worth the risk) and the antihistamines used as non-prescription sleep aids.

January 3, 2015

Cancer isn’t just bad luck

From Stuff

Bad luck is responsible for two-thirds of adult cancer while the remaining cases are due to environmental risk factors and inherited genes, researchers from the Johns Hopkins Kimmel Cancer Center found.

The idea is that some, perhaps many, cancers come from simple copying errors in DNA replication. Although DNA copying and editing is impressively accurate, there’s about one error for every three cell divisions, even when nothing is wrong. Since the DNA error rate is basically constant, but other risk factors will be different for different cancers, it should be possible to separate them out.

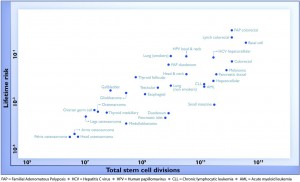
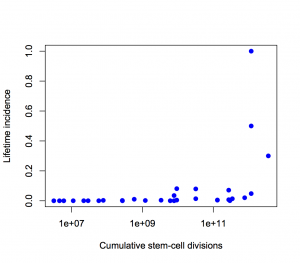
For a change, this actually is important research, but it has still been oversold, for two reasons. Here’s the graph from the paper showing the ‘2/3’ figure: the correlation in this graph is about 0.8, so the proportion of variation explained is the square of that, about two-thirds.  (click to embiggen)

cancer-logrisk

There are two things to notice about this graph. First, there are labels such as “Lung (smokers)” and “Lung (non-smokers)”, so it’s not as simple as ‘bad luck’.  Some risk factors have been taken into account. It’s not obvious whether this makes the correlation higher or lower.

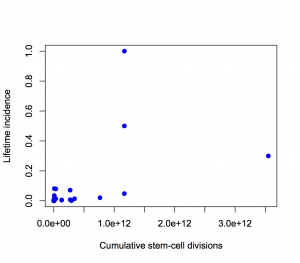
Second, the y-axis is on a log scale, so the straight line fit isn’t to cancer incidence and the proportion of variation explained isn’t a proportion of cancer risk.  Using a log scale for incidence is absolutely right when showing the biological relationship, but you can’t read proportions of incidence explained off that graph.  This is what the graph looks like when the y-axis is incidence, either with the x-axis still on a logarithmic scale

semilog

or with neither axis on a logarithmic scale

nolog

The proportion of variation explained is 18% and 28% respectively.

It’s ok to transform the x-axis as much as we like, so I looked at a square root transformation on the x-axis (based on the slope of the log-log graph). This gets the proportion of incidence explained up to about one third. Not two-thirds.

Using the log scale gives a lot more weight to the very rare cancers in the lower left corner, which turn out not to have important modifiable risk factors. Using an untransformed y-axis gives equal weight to all cancers, which is what you want from a medical or public health point of view.

Except, even that isn’t quite right. If you look at my two graphs it’s clear that the correlation will be driven by the top three points. Two of those are familial colorectal cancers, and the incidence quoted is the incidence in people with the relevant mutations; the third is basal cell carcinoma, which barely counts as cancer from a medical or public health viewpoint

If we leave out the familial cancers and basal cell carcinoma, the proportion explained drops to about 10%.

If we leave out put back basal cell carcinoma as well, something statistically interesting happens. The correlation shoots back up again, but only because it’s being driven by a single point. A more honest correlation estimate, predicting each point based on the other points and not based on itself, is much lower.

So, in summary: the “two-thirds of cancers explained” is Just Wrong. Doing a mathematically correct calculation gives about one third. Doing a calculation that’s actually relevant to cancer in the population gives even smaller values. (update) That’s not to say that DNA replication errors are unimportant — the paper makes it clear that they are important.

January 2, 2015

Is this being sold to people who care if it works?

The Marlborough Express has a story today that begins

Kaye Nicholls tried every diet in the book without success but a fat-busting capsule produced by a Blenheim company has proved the catalyst for her weight loss.

The 54-year-old has shed a whopping 13.5 kilograms in eight weeks as part of the company’s “fat mates” trial in Blenheim.

It’s presumably no coincidence that this story appears on January 2nd, ready to exploit the New Year’s Resolution wave of dieters.

As you will have guessed, Ms Nicholls weight loss wasn’t typical. We aren’t told what the average weight loss was, just

“Tuatara Natural Products director Neil Charles-Jones said half the people on the trial lost an average of 5kg and the top 25 per cent shed more than 7kg.

That is, the average was 5kg loss among the 50% who lost the most — as far as we can tell from the story, the loss averaged over everyone could be zero.

Not only are we not told the average, the trial was uncontrolled, which makes it hard to tell how much of any benefit was due to the pill and how much just to starting a weight loss program.  The company does know that this is a problem, and so does the journalist, because the story actually says

Weight loss results were being sent to a bio-analyst to compare the capsule with the placebo effect and conclusions would be drawn by mid January.

You might wonder how they’re doing the comparison. The best way would be to look at how much weight is lost in people trying new, ineffective, weight loss products in uncontrolled trials. Slightly less good would be to use data from the placebo arm of controlled trials — it wouldn’t be as good, because we’re trying for a fair comparison, and this wasn’t a controlled trial.

However the analysis is being done, it is being done. The results will be available in a couple of weeks. If you cared about whether these pills really work, that would be the time to report the results.

If this were a medicine, controlled trials would be needed before it could be advertised and sold: the FDA criteria are weight loss of at least 5% persisting for at least a year.  It would also be illegal to use testimonials in advertising it. As it is, I’d guess a paper would think twice about accepting this story if it were a paid ad.

What’s really upsetting about the story is that this isn’t just pseudoscience. Tuatara Natural Products has public funding through both Plant & Food and Callaghan Innovation. Their product has a sensible mechanism (inhibition of α-amylase in the gut to slow down carbohydrate absorption). They should be interested in doing better.


(note: JohnPickering has a grumpier post about the same story)

December 19, 2014

Moving the goalposts

A century ago there was no useful treatment for cancer, nothing that would postpone death. A century ago, there wasn’t any point in screening for cancer; you might as well just wait for it to turn up. A century ago, it would still have been true that early diagnosis would improve 1-year survival.

Cancer survival is defined as time from diagnosis to death. That’s not a very good definition, but there isn’t a better one available since the start of a tumour is not observable and not even very well defined.  If you diagnose someone earlier, and do nothing else helpful, the time from diagnosis to death will increase. In particular, 1-year survival is likely to increase a lot, because you don’t have to move diagnosis much earlier to get over the 1-year threshold.  Epidemiologists call this “lead-time bias.”

The Herald has a story today on cancer survival in NZ and Australia that completely misses this issue. It’s based on an article in the New Zealand Medical Journal that also doesn’t discuss the issue, though the editorial commentary in the journal does, and also digs deeper:

If the average delay from presentation to diagnosis was 4 weeks longer in New Zealand due to delay in presentation by the patient, experimentation with alternative therapy, or difficulty in diagnosis by the doctor, the 1-year relative survival would be about 7% poorer compared to Australia. The range of delay among patients is even more important and if even relatively few patients have considerable delay this can greatly influence overall relative survival due to a lower chance of cure. Conversely, where treatment is seldom effective, 1-year survival may be affected by delay but it may have little influence on long-term survival differences. This was apparent for trans-Tasman differences in relative survival for cancers of the pancreas, brain and stomach.  However, relative survival for non-Hodgkin lymphoma was uniformly poorer in New Zealand suggesting features other than delay in diagnosis are important.

That is, part of the difference between NZ and Australian cancer survival rates is likely to be lead-time bias — Australians find out they have incurable cancer earlier than New Zealanders do — but part of it looks to be real advantages in treatment in Australia.

Digging deeper like this is important. You can always increase time from diagnosis to death by earlier diagnosis. That isn’t as useful as increasing it by better treatment.

[update: the commentary seems to have become available only to subscribers while I was writing this]

December 18, 2014

It’s beginning to look a lot like Christmas

In particular, we have the Christmas issue of the BMJ,  which is devoted to methodologically sound papers about silly things (examples including last year’s on virgin birth in the National Longitudinal Study of Youth, and the classic meta-analysis of randomised trials of parachute use)

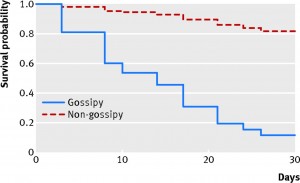
University of Auckland researchers have a paper this year looking at the survival rate of magazines in doctors’ waiting rooms

We defined a gossipy magazine as one that had five or more photographs of celebrities on the front cover and a most gossipy magazine as one that had up to 10 such images. The Economist and Time magazine were deemed to be non-gossipy. The rest of the magazines did not meet the gossipy threshold as they specialised in, for example, health, the outdoors, the home, and fashion. Practice staff placed 87 magazines in three piles in the waiting room and removed non-study magazines. To blind potential human vectors to the study, BA marked a unique number on the back cover of each magazine. Twice a week the principal investigator arrived at work 30 minutes early to record missing magazines.

And what did they find?

F1.large


December 17, 2014

Good news, bad percentages

In the New York Times, a story reporting on new Ebola research, which suggests there are fewer unreported cases and less transmission in the general community than was previously thought. This is good news both because there aren’t as many cases, and also because control might be easier.

One unfortunate feature of the NYT story:

By looking at virus samples gathered in Sierra Leone and contract-tracing data from Liberia, the scientists working on the new study estimated that about 70 percent of cases in West Africa go unreported. That is far fewer than earlier estimates, which assumed that up to 250 percent did.

It’s hard to see how the scientific community could have assumed 250% of cases were unreported. Mark Lieberman at Language Log looks at the research paper to find, firstly, that the ‘70%’ and ‘250%’ are the unreported cases as a fraction of the reported cases. That is, 70% unreported means that for every 100 reported cases there are 70 unreported, which one would usually call 41% unreported.  He also notes that 70% is the upper bound of a range estimated the paper, with the best estimate being 17% (that is, 17/117, or 14.5% unreported). What seems to have happened is that the word ‘underreported’ was changed to ‘unreported.’

What Language Log doesn’t look at is the transmission of these percentages.  There’s a story (and press release)at Yale News, home of most of the researchers, which has an intermediate mutation

Researchers were also able to estimate that for every Ebola case reported, fewer than one went unreported. This estimate, that up to 70% of cases were not reported, is significantly lower than previous estimates. “For Sierra Leone, underreporting is lower than some more speculative estimates that ran as high as 250%,” Townsend noted.

with ‘underreporting’ in the direct quotation and ‘unreported’ in the main text. From there, it’s easy to see how the distinction could have been tidied away at the NYT and at TheHill.com

December 9, 2014

Health benefits and natural products

The Natural Health and Supplementary Products Bill is back from the Health Committee. From the Principles section of the Bill:

(c) that natural health and supplementary products should be accompanied by information that—

   (i)is accurate; and

   (ii)tells consumers about any risks, side-effects, or benefits of using the product:

(d)that health benefit claims made for natural health and supplementary products should be supported by scientific or traditional evidence.

There’s an unfortunate tension between (c)(i) and (d), especially since (for the purposes of the Bill) the bar for ‘traditional evidence’ is set very low: evidence of traditional use is enough.

Now, traditional use obviously does convey some evidence as to safety and effectiveness. If you wanted a herbal toothache remedy, you’d be better off looking in Ngā Tipu Whakaoranga and noting traditional Māori use of kawakawa, rather than deciding to chew ongaonga.

For some traditional herbal medicines there is even good scientific evidence of a health benefit. Foxglove, opium poppy, pyrethrum, and willowbark are all traditional herbal products that really are effective. Extracts from two of them are on the WHO essential medicines list, as are synthetic adaptions of the other two. On the other hand, these are the rare exceptions — these are the  ones where a vendor wouldn’t have to rely only on traditional evidence.

It’s hard to say how much belief in a herbal medicine is warranted by traditional use, and different people would have different views. It would have been much better to allow the fact of traditional use to be advertised itself, rather than allowing it to substitute for evidence of benefit.  Some people will find “traditional Māori use” a good reason to buy a product, others might be more persuaded by “based on Ayurvedic principles”.  We can leave that evaluation up to the consumer, and reserve claims of ‘health benefit’ for when we really have evidence of health benefit.

This isn’t treating science as privileged, but it is treating science as distinguished. There are some questions you really can answer by empirical study and repeatable experiment (as the Bill puts it), and one of them is whether a specific treatment does or does not have (on average) a specific health benefit in a specific group of people.


December 4, 2014

Fortune cookie science reporting

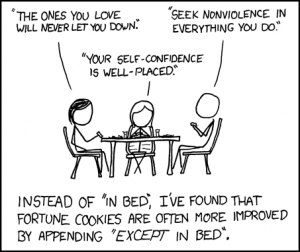
fortune_cookies

For science, the appropriate addition is “in mice.”

The Herald’s story (from the Daily Telegraph) “The latest 12 hour diet backed by science” has exactly this problem. It begins

Dieters hoping to shed the kilos should watch the clock as much as their calorie intake after scientists discovered that limiting the time span in which food is consumed can stop weight gain.

Confining meals to a 12-hour period, such as 8am to 8pm, and fasting for the remainder of the day, appears to make a huge difference to whether fat is stored, or burned up by the body.

It’s not until paragraph 6 that we find out this isn’t about dieters, it’s about mice.  The differences truly are huge — 5% of body weight within a few days, 25% by the end of the study — so you’d think it would be easy to demonstrate these benefits in humans if they were real.

Earlier this year, a different research group published a summary of studies on time-restricted feeding.  There are no controlled studies in humans. The uncontrolled studies aren’t especially high quality, and the ones with a 12-hour period mostly just take advantage of the no-daytime-eating rule observed by Muslims during the month of Ramadan. However, it’s still notable that the average weight reductions from a 4-week period of 12-hour food restrictions were 1-3%.


November 18, 2014

Cholesterol is bad for you

That doesn’t sound like a very interesting headline, but an important clinical trial whose results were released today has made definite steps towards re-convincing researchers on this point.

The trial, IMPROVE-IT, looked at adding a new drug, ezetimibe, to one of the standard statin drugs for cholesterol lowering, in people who had previously had a heart attack. Ezetimibe works by blocking cholesterol absorption in the gut, a completely different mechanism to the statins, which block cholesterol synthesis. The drug had previously shown unconvincing results in a preliminary study, made even less convincing by the behaviour of the manufacturer. There was increasing uncertainty that the cholesterol-lowering effect of the statins was really how they prevented heart disease, since no other drug appeared to be able to do the same thing.

Now, IMPROVE-IT has found a reduction in heart attacks and strokes. It’s very small — only 2 percentage points, even in this high-risk group of patients — but it looks real. Given the price of ezetimibe it probably won’t be widely used immediately, but it comes off patent in a few years and then use might spread a bit.  The results are also encouraging for dietary approaches to lowering cholesterol by reducing absorption: some cereals, and spreads with plant sterols.

Other stories: Forbes, New York Times